Overview: 88 Indicators, 1,584 Data Points, 18 Automakers
The 2026 Lead the Charge Auto Supply Chain Leaderboard — the fourth edition of the benchmark report published on March 2, 2026 by the coalition of Transport & Environment, Sierra Club, Public Citizen, and Earthworks — represents the most comprehensive, publicly available assessment of environmental, social, and governance (ESG) performance across the global electric vehicle supply chain. This year’s evaluation rigorously examined 18 global automakers, applying a standardized framework of 88 distinct indicators spanning raw material sourcing, manufacturing emissions, labor rights, Indigenous Peoples’ protections, battery lifecycle management, and transparency mechanisms. Each indicator was verified using publicly disclosed data, third-party audits, corporate sustainability reports, supplier codes of conduct, and regulatory filings — yielding a total of 1,584 data points that form the empirical backbone of the ranking. Unlike proprietary ESG scores reliant on modeled estimates or self-reported narratives, this methodology prioritizes verifiability and comparability, requiring evidence of concrete action — not just policy statements — to award points. The scope deliberately extends beyond final-assembly plants to include upstream tiers: cobalt and lithium mining, steel and aluminum smelting, cathode and anode production, and battery cell manufacturing. This granular focus reflects an industry-wide recognition that over 70% of an EV’s lifetime carbon footprint is now embedded in its supply chain — long before the first bolt is tightened on the assembly line. As electrification accelerates, the Leaderboard has evolved from a diagnostic tool into a strategic compass for investors, regulators, and procurement teams seeking objective signals of operational resilience and ethical integrity.
The report confirms a clear inflection point in industry maturity: industry scores have nearly doubled since the inaugural 2022 edition, signaling structural progress rather than marginal gains. Yet the data also reveals persistent gaps in ambition and execution. No automaker achieves even half of the theoretical best-in-class score — capped at 86% — underscoring that current leadership reflects relative excellence within a still-early-stage ecosystem, not absolute sustainability. The evaluation methodology explicitly weights indicators by materiality and risk exposure: for example, failure to implement a grievance mechanism for mine-affected communities carries heavier penalties than delayed publication of a Tier 2 supplier audit summary. This risk-proportionate scoring ensures that high-consequence omissions — such as ignoring labor practice concerns red flags in mica supply chains or omitting decarbonization targets for primary aluminum — cannot be offset by superficial improvements elsewhere. The sheer volume of data — 1,584 points across 18 companies — enables longitudinal analysis impossible in single-year snapshots, revealing not just who leads, but how fast they’re moving, where acceleration is occurring, and which domains remain stubbornly resistant to change. For supply chain professionals, this isn’t abstract benchmarking; it’s a real-time map of compliance exposure, reputational vulnerability, and procurement leverage.
The Five Leaders: Tesla, Ford, Volvo, Mercedes, Volkswagen at 2x Improvement Rate
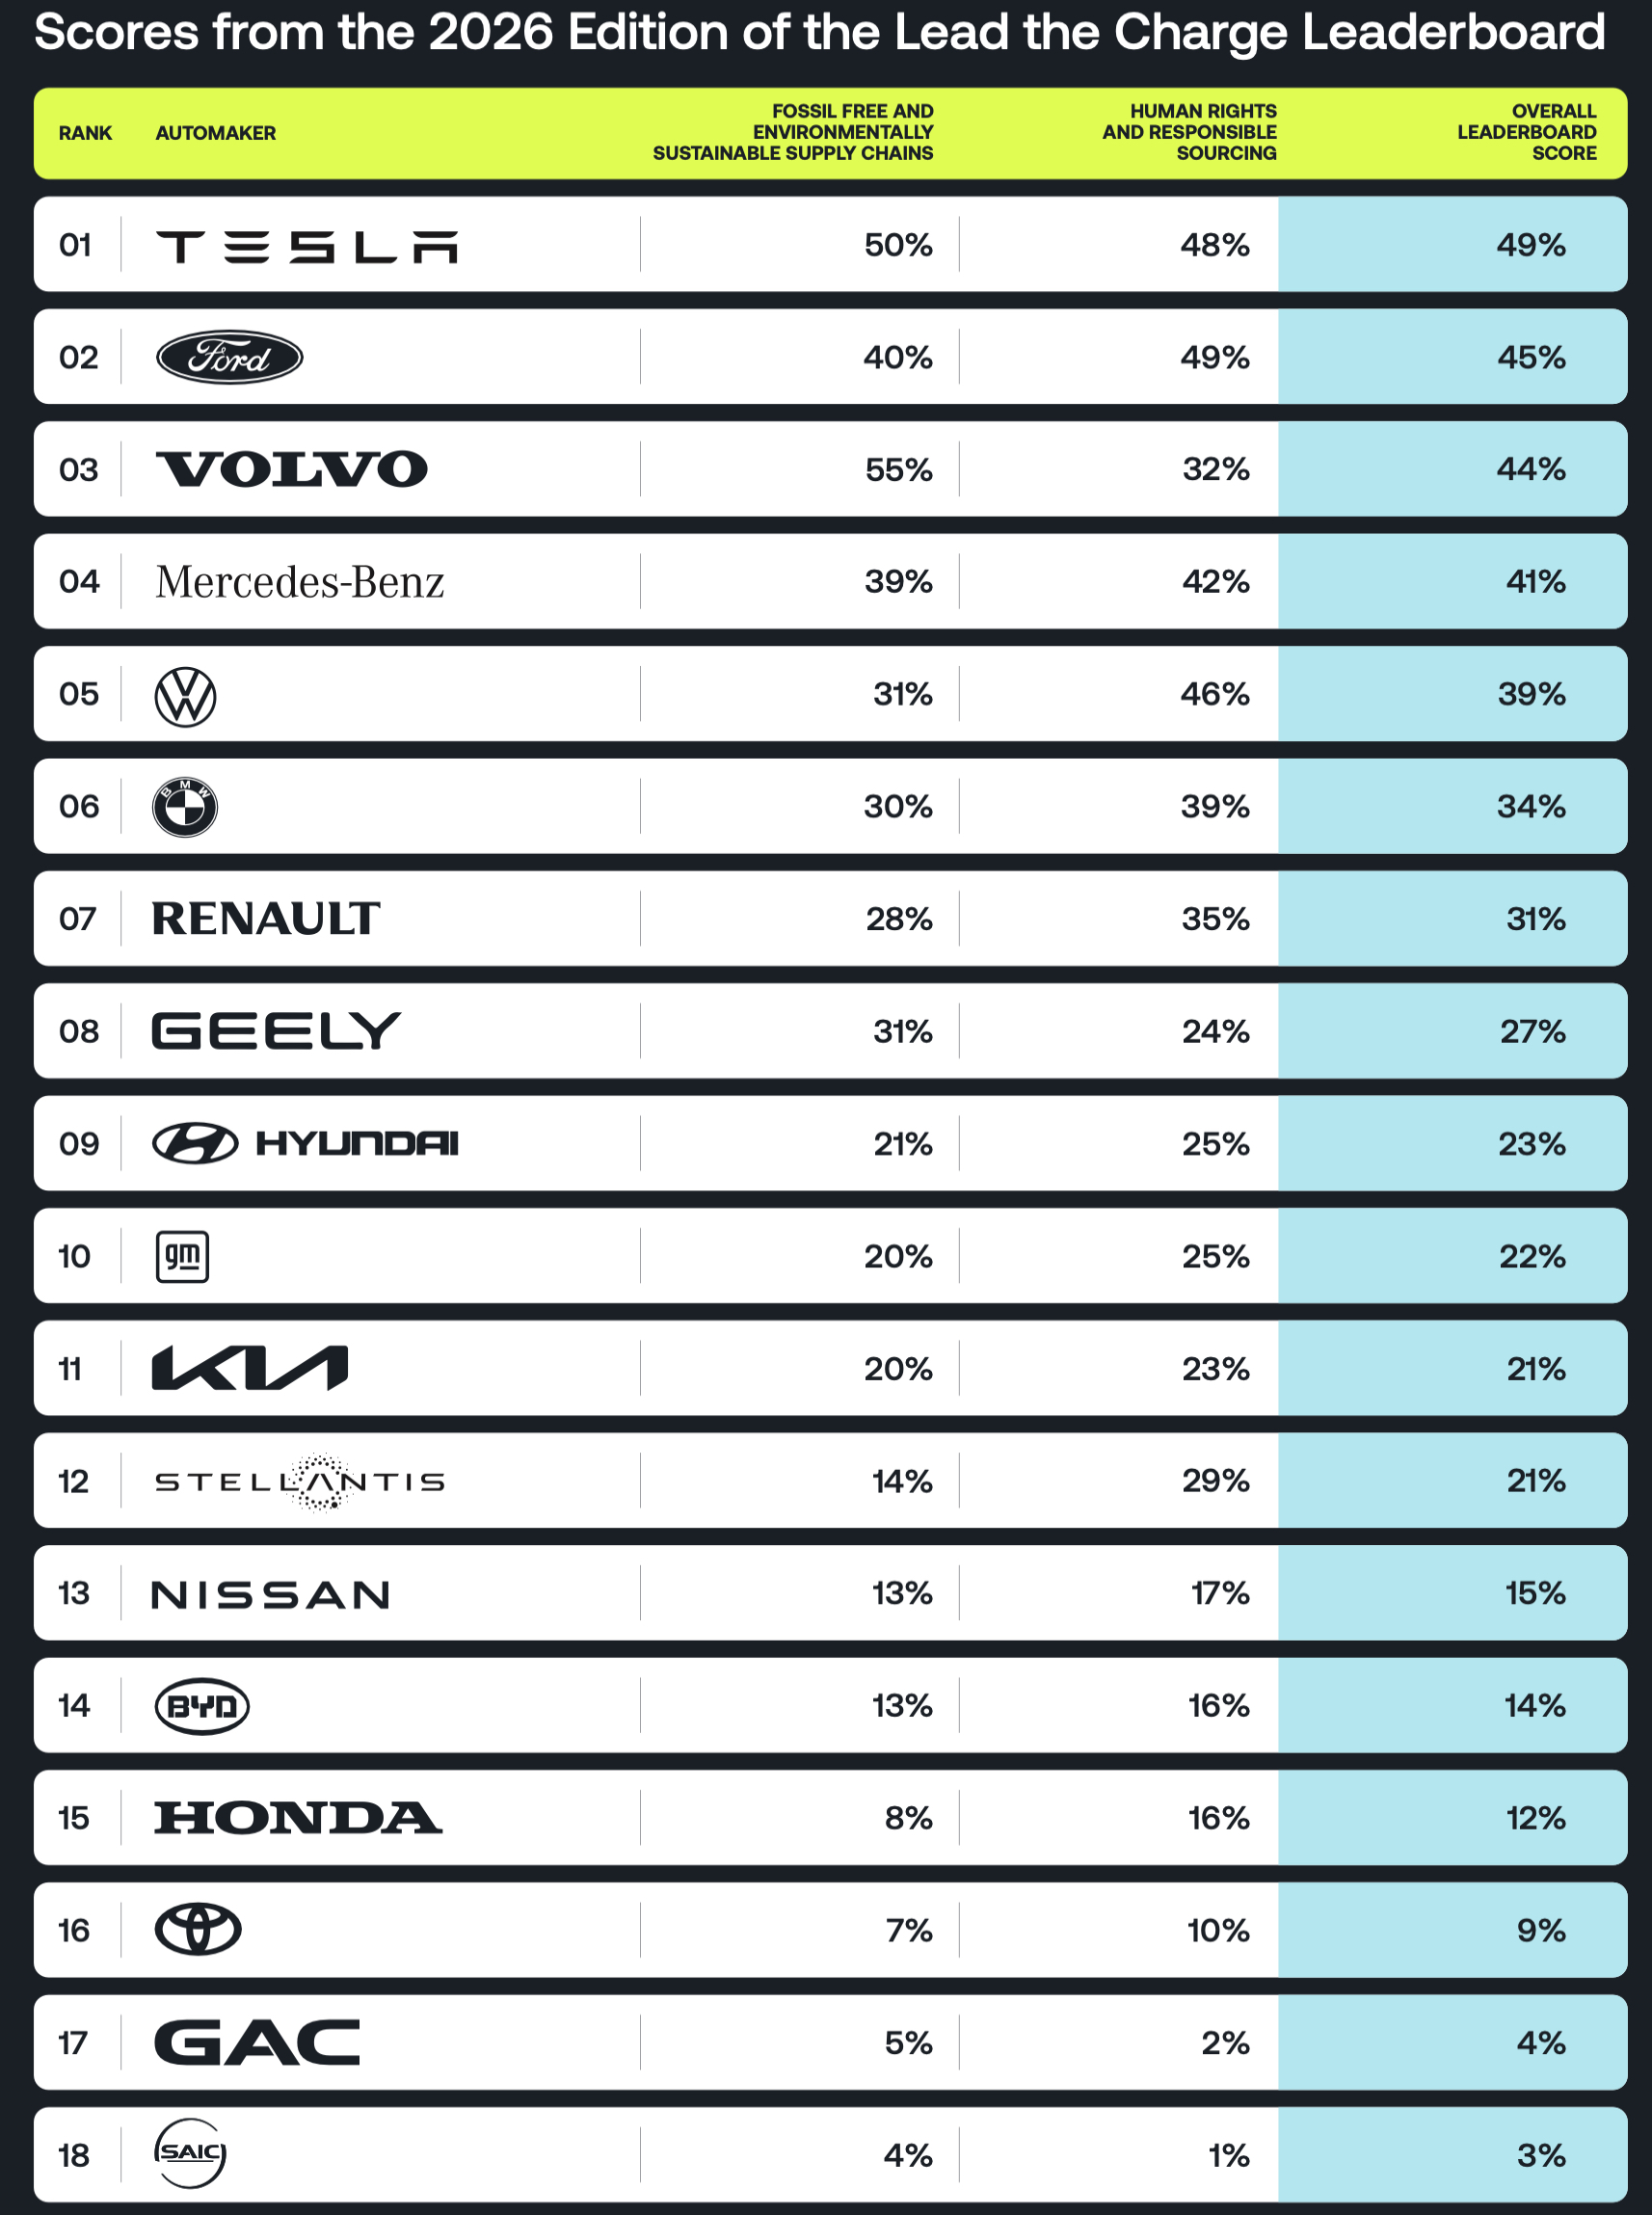
Tesla maintains its position at the summit of the 2026 Leaderboard with an overall score of 49%, securing the top rank for the second consecutive year and marking a 6 percentage point improvement over its 2025 result. This places Tesla ahead of Ford, Volvo, Mercedes-Benz, and Volkswagen — the other four automakers comprising the elite tier. Critically, these five leaders are improving their aggregate scores at twice the rate of the remaining 13 automakers, demonstrating a self-reinforcing cycle of disclosure, accountability, and operational integration. Their advantage stems not from isolated initiatives but from systemic coherence: Tesla’s vertically integrated battery material strategy, Ford’s binding supplier climate requirements, Volvo’s mandatory low-carbon steel procurement for the ES90, Mercedes’ public disclosure of specific quantities of low-carbon aluminum used in the CLA, and Volkswagen’s expanded due diligence on cobalt refining partners all reflect embedded governance rather than ad hoc projects. This cohort shares three distinguishing traits: first, consistent annual publication of audited sustainability reports; second, explicit inclusion of Tier 1 and Tier 2 suppliers in code-of-conduct enforcement; and third, quantified, time-bound targets for Scope 3 emissions reduction — particularly in high-impact categories like steel, aluminum, and battery materials. Their leadership is measurable not only in points gained but in the depth of traceability they demand: all five now require battery suppliers to disclose origin and carbon intensity of cathode active materials, a prerequisite for meaningful decarbonization.
That said, the gap between aspiration and achievement remains stark even among leaders. While Tesla leads with 49%, it still falls far short of the 86% theoretical ceiling — meaning more than one-third of high-impact sustainability actions remain unimplemented across its value chain. Similarly, Volvo’s ES90 and Mercedes’ CLA represent pioneering disclosures of low-carbon steel and aluminum usage, yet both models constitute a tiny fraction of each company’s total production volume. The Leaderboard’s scoring does not reward pilot programs alone; it demands scalability and institutionalization. For instance, Mercedes earns points for disclosing low-carbon aluminum quantities in the CLA, but loses points for lacking a group-wide target to phase out coal-based aluminum by 2035. This nuance prevents greenwashing while highlighting precisely where leadership must deepen: from selective transparency to enterprise-wide mandates, from voluntary supplier engagement to contractual decarbonization clauses, and from reactive compliance to proactive innovation in secondary material flows. The 2x improvement rate enjoyed by the top five is therefore less a sign of market dominance and more evidence of disciplined resource allocation toward supply chain governance — a discipline increasingly recognized by credit rating agencies as reducing long-term financing costs and enhancing brand equity.
“The 2026 Leaderboard shows that leading automakers are no longer treating supply chain sustainability as a side project — it’s becoming core to procurement strategy, investor relations, and product development. But the data also proves that ‘good enough’ is rapidly becoming obsolete.” — Lead the Charge coalition statement, March 2026
China’s Breakout: Geely, BYD and Renault’s Record Score Jumps
In a notable shift reflecting evolving global dynamics, Chinese automakers emerged as the most aggressive improvers in the 2026 assessment, with Geely, BYD, and Renault tied for the largest score jump — a development that underscores how ESG performance is no longer a Western monopoly but a competitive necessity across geographies. Geely stands out as the top-scoring East Asian automaker, surpassing both Toyota and Hyundai in the overall ranking — a significant reversal given historical perceptions of regional ESG lag. This ascent is anchored in Geely’s systematic expansion of supplier due diligence, including mandatory human rights impact assessments for Tier 1 battery material suppliers and the integration of environmental performance metrics into its supplier scorecards. BYD, identified as the world’s largest EV maker, achieved its leap forward through foundational governance upgrades: it implemented its first supplier code of conduct and launched a publicly accessible grievance mechanism — two baseline requirements previously absent from its public disclosures. These are not cosmetic additions; they represent institutional shifts enabling third-party verification and community recourse, directly addressing long-standing criticisms about opacity in China’s EV supply web. Renault’s parallel surge reflects its deepening alignment with European regulatory expectations, particularly through accelerated adoption of EU Battery Regulation-aligned traceability systems across its joint ventures in China and Morocco.
This tripartite surge signals a broader recalibration of strategic priorities among manufacturers operating in or exporting to regulated markets. For BYD, the introduction of a formal code of conduct and grievance channel is not merely reputational hygiene — it is a prerequisite for eligibility in public procurement tenders across the EU and for access to green financing instruments tied to sustainability-linked loans. Geely’s rise demonstrates how vertical integration — notably through its ownership stakes in battery recyclers and lithium producers — creates both accountability pressure and operational leverage to enforce standards upstream. Crucially, none of these companies scored highly on legacy metrics like historical emissions reporting; instead, their gains came from implementing forward-looking, verifiable systems: real-time mineral traceability platforms, third-party audited labor assessments in cathode factories, and publicly disclosed recycling yield rates for end-of-life batteries. Their rapid ascent validates the Leaderboard’s design principle: rewarding actionable infrastructure over retrospective narrative. It also challenges assumptions about developmental stage — suggesting that newer, digitally native EV players may leapfrog legacy automakers in building agile, transparent supply chain governance from the ground up, unburdened by decades of fragmented supplier relationships and paper-based compliance.
The Laggards: Toyota, GM, SAIC, GAC and the Strategic Cost of Inaction
At the opposite end of the spectrum, Toyota, General Motors, SAIC Motor, and GAC Group occupy the bottom quartile of the 2026 Leaderboard — not due to minor omissions, but because of near-zero progress on steel and aluminum decarbonization, a critical failure given that these two materials account for over 40% of the embodied carbon in an average EV chassis and battery enclosure. Toyota, long celebrated for hybrid efficiency, receives minimal credit for supply chain sustainability, scoring near the floor despite its scale and resources. GM’s situation is particularly consequential: it is the only automaker failing to publish an annual sustainability report, a basic transparency requirement that caused it to fall below both Geely and Hyundai in the rankings — a stark indicator of governance deficit. This omission is not procedural; without a public, audited report, investors cannot assess progress against GHG targets, verify labor standards in battery component factories, or evaluate claims about recycled content. SAIC and GAC exhibit similar patterns: strong domestic EV sales growth paired with minimal public disclosure of Tier 2 supplier audits, no published timelines for phasing out coal-based aluminum, and no grievance mechanisms accessible to communities impacted by lithium extraction in Qinghai or Sichuan. Their collective stagnation reveals a dangerous strategic misalignment — treating ESG as a cost center rather than a risk mitigation and value creation lever.
The strategic cost of this inaction is mounting rapidly. First, financing implications are tangible: banks increasingly apply ESG-adjusted risk premiums, and GM’s lack of a sustainability report directly impedes its ability to secure sustainability-linked loans with favorable interest rates. Second, market access is tightening: the EU Battery Regulation — effective for vehicles placed on the market from February 2027 — mandates full traceability of cobalt, lithium, nickel, and graphite for all EVs sold in Europe. Automakers without robust mineral tracking systems face customs delays, certification denials, and potential exclusion from public charging infrastructure contracts. Third, talent acquisition suffers: engineering graduates and mid-career professionals increasingly prioritize employers with demonstrable ESG commitments, and laggards report higher attrition in sustainability and procurement functions. Most critically, the 2x improvement rate differential between leaders and laggards means the competitive gap is widening exponentially — not linearly. A company improving at 2% annually versus peers advancing at 4% doubles its relative disadvantage every 35 years; in fast-moving sectors like EVs, where product cycles compress to 18 months, that compounding effect manifests as lost market share, eroded brand trust, and diminished bargaining power with Tier 1 battery suppliers demanding carbon accounting capabilities. The bottom quartile’s inertia is therefore not passive — it is an active choice with accelerating financial, regulatory, and reputational consequences.
The Regulatory Catalyst: EU Battery Regulation Reshaping Global Supply Chain Decarbonization
The EU Battery Regulation, cited explicitly in the 2026 Leaderboard report as a key driver of accelerated action, is functioning precisely as intended: transforming a fragmented, voluntary landscape into a globally coordinated, legally enforceable framework for supply chain accountability. Effective for cars placed on the EU market from February 2027, the regulation mandates that automakers and battery producers demonstrate traceability of key battery materials — cobalt, lithium, nickel, and graphite — back to the mine of origin, accompanied by verified environmental and social due diligence documentation. This is not a reporting exercise; it requires integration of digital traceability platforms (such as blockchain-enabled systems or certified ERP modules), third-party verification of smelter compliance with OECD Due Diligence Guidance, and public disclosure of carbon intensity per kilogram of processed material. The regulation’s extraterritorial reach is profound: any automaker wishing to sell EVs in the EU — regardless of headquarters location — must comply, forcing Chinese, Korean, and American manufacturers to retrofit their procurement systems to meet European standards. This regulatory gravity well is already reshaping investment flows: battery recyclers in Germany and France report 300% YoY growth in contracts with Asian cathode producers seeking pre-certification, while North American lithium refiners are accelerating partnerships with EU-based auditors to achieve “battery-grade” certification status.
Crucially, the regulation operates as a transmission mechanism for carbon pricing. By requiring disclosure of Scope 3 emissions intensity for battery materials, it makes invisible upstream carbon costs visible — and therefore negotiable. Automakers can now benchmark suppliers not just on price and lead time, but on verified grams of CO₂e per kWh of battery capacity delivered. This transforms decarbonization from a CSR initiative into a procurement KPI, directly linking supplier selection to cost of capital: lenders increasingly tie loan covenants to verified reductions in upstream emissions intensity. The regulation also catalyzes standardization — mandating use of the International Material Data System (IMDS) and the Battery Passport format — thereby reducing verification costs across the board. For suppliers, compliance is no longer optional; non-compliant smelters face de-listing from the Responsible Minerals Initiative (RMI) and exclusion from major OEM approved-vendor lists. The ripple effects extend beyond batteries: steel and aluminum producers supplying EU-bound EVs are now required to provide Environmental Product Declarations (EPDs) aligned with EN 15804, pushing decarbonization pressure further upstream. In essence, the EU Battery Regulation is not merely a compliance hurdle — it is the central nervous system of the emerging green supply chain, converting abstract ESG principles into concrete, auditable, and financially consequential business requirements.
The 86% Horizon: What Best-in-Class Performance Tells Us About What’s Possible
The 86% theoretical best-in-class score established by the Lead the Charge coalition serves not as an arbitrary ceiling but as a meticulously constructed benchmark of what is technically and commercially feasible today — based on existing technologies, verified supplier practices, and regulatory precedents. It represents the sum of all indicators where leading companies have demonstrated scalable, auditable implementation: full traceability of all battery minerals; 100% renewable energy use in battery cell manufacturing; binding contractual requirements for Tier 2 smelters to eliminate coal-based power by 2030; mandatory third-party human rights impact assessments for all mines supplying >1% of annual cobalt demand; public disclosure of battery recycling yield rates exceeding 95%; and grievance mechanisms with independent oversight accessible to affected communities. Achieving 86% does not require speculative breakthroughs — it requires deployment of known solutions at scale, sustained investment in supplier capacity building, and unwavering executive commitment to integrate sustainability into core procurement and product engineering processes. That no automaker reaches even 50% of this horizon — with Tesla’s 49% being the highest — is less a commentary on technological limits than on organizational inertia, siloed decision-making, and underinvestment in supply chain intelligence infrastructure. The gap is not scientific; it is managerial and cultural.
What the 86% horizon reveals most urgently is the asymmetry of risk and opportunity. Automakers operating at 20–30% are exposed to escalating regulatory penalties, investor divestment, and customer skepticism — yet they possess the capital and scale to close the gap rapidly if leadership prioritizes it. Conversely, those approaching 40–45%, like Tesla and Volvo, face diminishing returns on incremental efforts: the last 10 percentage points require tackling the hardest, most opaque tiers — artisanal cobalt refiners, informal lithium leaching operations, and legacy aluminum smelters with decades-old infrastructure. This final stretch demands unprecedented collaboration: industry consortia to co-fund clean smelting tech, harmonized auditing protocols across competitors, and public-private partnerships to finance grid decarbonization in mineral-rich developing economies. The horizon also exposes a critical blind spot in current frameworks: it measures actions taken, not outcomes delivered. A company scoring 49% may have excellent policies but subpar enforcement; another at 35% may have weaker policies but superior on-the-ground verification. Future editions of the Leaderboard are expected to weight outcome-based metrics — such as actual tons of CO₂e reduced in Tier 2 steel production — more heavily than policy existence. Ultimately, the 86% is not a finish line but a mirror — reflecting not what is possible in a lab, but what is achievable in the real world of global manufacturing, if the will, investment, and governance structures align. For supply chain professionals, it is both a challenge and a roadmap: the path forward is clear, even if the climb remains steep.
Source: electrek.co
This article was AI-assisted and reviewed by our editorial team.