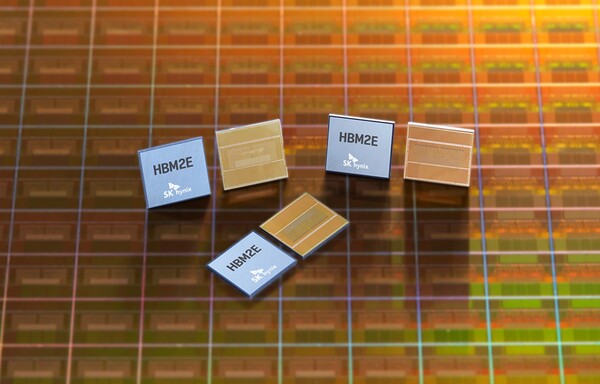
SK Hynix Drives Strategic Reorientation Toward Taiwan Amid AI Memory Boom
The rapid ascent of High Bandwidth Memory (HBM) has fundamentally reconfigured Korea’s memory semiconductor export architecture. According to KITA data released March 3, 2026, Korea’s total memory exports reached $94.613 billion in 2025, driven by concentrated, high-value HBM shipments.
SK Hynix’s expanded HBM supply to NVIDIA — routed through Taiwan for packaging at TSMC — accounts for the 87.2% year-on-year surge in exports to Taiwan, from $14.46 billion in 2024 to $27.076 billion in 2025.
HBM is classified as exported to Taiwan (not the U.S.) because final assembly occurs at TSMC’s packaging facilities. This supply chain topology — not market demand geography — explains KITA’s trade statistics. Taiwan has been transformed from a minor memory buyer into Korea’s second-largest memory export destination in just five years.
Taiwan’s Share Soars from 6% to 28.6%: A Structural Pivot, Not a Cyclical Blip
Taiwan’s share of Korea’s memory semiconductor exports rose from approximately 6% in 2020 to 14.5% in 2024, then leaped to 28.6% in 2025 — a cumulative increase of +14.1 percentage points in a single year.
The growth curve is striking: from approximately $3 billion in 2023, to $14.46 billion in 2024, to $27.076 billion in 2025. This pace far exceeds legacy DRAM market growth and confirms that memory value is concentrating upstream in the HBM supply chain.
- Taiwan memory export share: 6% (2020) → 14.5% (2024) → 28.6% (2025)
- Taiwan export value: ~$3B (2023) → $14.46B (2024) → $27.076B (2025)
- Year-on-year growth (2025): +87.2%
- China vs Taiwan gap: narrowed to just $3.914 billion ($30.99B vs $27.076B)
Kim Hyuk-jung, Associate Research Fellow at Korea Institute for International Economic Policy: “As AI chip demand grows, the pattern of supplying HBM to TSMC in Taiwan will strengthen. There is also a possibility that exports to Taiwan could surpass those to China.”
China’s Share Falls to 32.7%: From Dominance to Managed Diversification
Korea’s memory semiconductor exports to China have declined from a peak of approximately 70% in the early 2010s to 32.7% ($30.99 billion) in 2025. The contraction is multi-phase: falling to around 50% after 2018 amid U.S.-China tech tensions, then entering the 30% range in 2024, before settling at 32.7% in 2025.
Samsung Electronics’ Xi’an NAND plant (Shaanxi) and SK Hynix’s Wuxi DRAM plant (Jiangsu) and Dalian NAND plant (Liaoning) face intensified regulatory scrutiny. Since the Trump administration’s second term, these plants have had their Validated End User (VEU) status revoked — meaning every advanced semiconductor equipment import now requires case-by-case U.S. Department of Commerce approval.
As Kim Hyuk-jung noted, equipment imports to Shaanxi and Jiangsu are “occurring more intermittently than in the past,” and “as new equipment imports are not active, there is a possibility that production capacity (CAPA) at Chinese plants may gradually shrink naturally.” This natural attrition raises unit costs and diminishes competitiveness relative to Korea’s HBM-focused domestic fabs.
Geopolitical Arbitrage: How U.S. Export Controls Reshape Memory Logistics
U.S. export controls function as powerful spatial arbiters — redirecting material flows, incentivizing jurisdictional intermediation, and elevating specific nodes in the global semiconductor value chain. VEU status revocation imposed persistent friction on equipment import cycles at Samsung and SK Hynix Chinese plants.
The result is a multi-tiered export architecture: high-tech shipments to U.S.-allied jurisdictions (Taiwan, U.S., Japan) under streamlined licensing; HBM routed via Taiwan for TSMC packaging, then to U.S. data centers; and legacy memory shipped to China under narrower individual licenses.
KITA data reveals that HBM exports to China are essentially absent from reported statistics — not because demand is lacking, but because no broadly licensed pathway exists under current U.S. export regulations. Korean firms choose Taiwan not in isolation, but as the optimal intersection of compliance, predictability, and scalability. TSMC functions as a geopolitical logistics partner where Korean memory, U.S. design, and Taiwanese packaging converge under shared regulatory guardrails.
Supply Chain Transfer Costs and Net Strategic Benefits
Redirecting tens of billions in memory exports from China to Taiwan carries real transfer costs. Logistics complexity increases as HBM shipments require specialized air freight and customs brokerage. Working capital cycles lengthen with TSMC’s contract payment terms. Intellectual property exposure rises through deeper technical co-development disclosure.
Yet these costs are deliberately absorbed because strategic benefits outweigh frictions. High-value HBM sold to U.S. and Taiwan customers commands significant price premiums over legacy DRAM sold to Chinese buyers — a dynamic reinforced by TSMC contracts primarily denominated in U.S. dollars, insulating Korean memory firms from renminbi exchange rate volatility.
Korean firms are reallocating capital expenditure accordingly — channeling investment toward HBM-dedicated production lines at Icheon and Cheongju rather than expanding Chinese plants under regulatory uncertainty. This geographic and functional bifurcation represents strategic concentration of high-value manufacturing in compliant, allied jurisdictions aligned with both current regulatory reality and long-term AI infrastructure demand growth.
Scenario Planning: Three Futures for Korea’s Memory Export Architecture in 2026
Three plausible scenarios emerge for Korea’s memory export landscape, grounded in current KITA data and AI infrastructure demand signals. In the Base Case, Taiwan’s share stabilizes at 30-32% by end-2026, while China’s slips to 28-30% — making Taiwan the top memory export destination for the first time. This assumes continued HBM3e ramp-up and no major U.S. export control escalation.
In the Accelerated Scenario, triggered by designation of additional HBM variants as controlled items under U.S. Export Administration Regulations, Taiwan’s share could approach 35% by Q4 2026. Conversely, the Disruption Scenario — triggered by a U.S.-China détente restoring VEU status, or a TSMC capacity shortfall — could compress Taiwan’s share by several percentage points. However, KITA data suggests strong path dependency: the $27.076 billion 2025 baseline is anchored by multi-year supply agreements, not spot-market transactions.
Stakeholder analysis reinforces continuity: U.S. policymakers view the Korea-Taiwan-U.S. memory-AI nexus as a cornerstone of technological resilience; Korean firms treat TSMC partnerships as non-substitutable strategic assets. The numbers — $94.613 billion total exports, $27.076 billion to Taiwan, $30.99 billion to China, 28.6% and 32.7% shares, 87.2% growth from a 6% starting point in 2020 — all converge on one conclusion: Korea’s memory export future is being forged in the HBM supply chain, not the legacy DRAM bulk market.
Source: businesskorea.co.kr
This article was AI-assisted and reviewed by our editorial team.