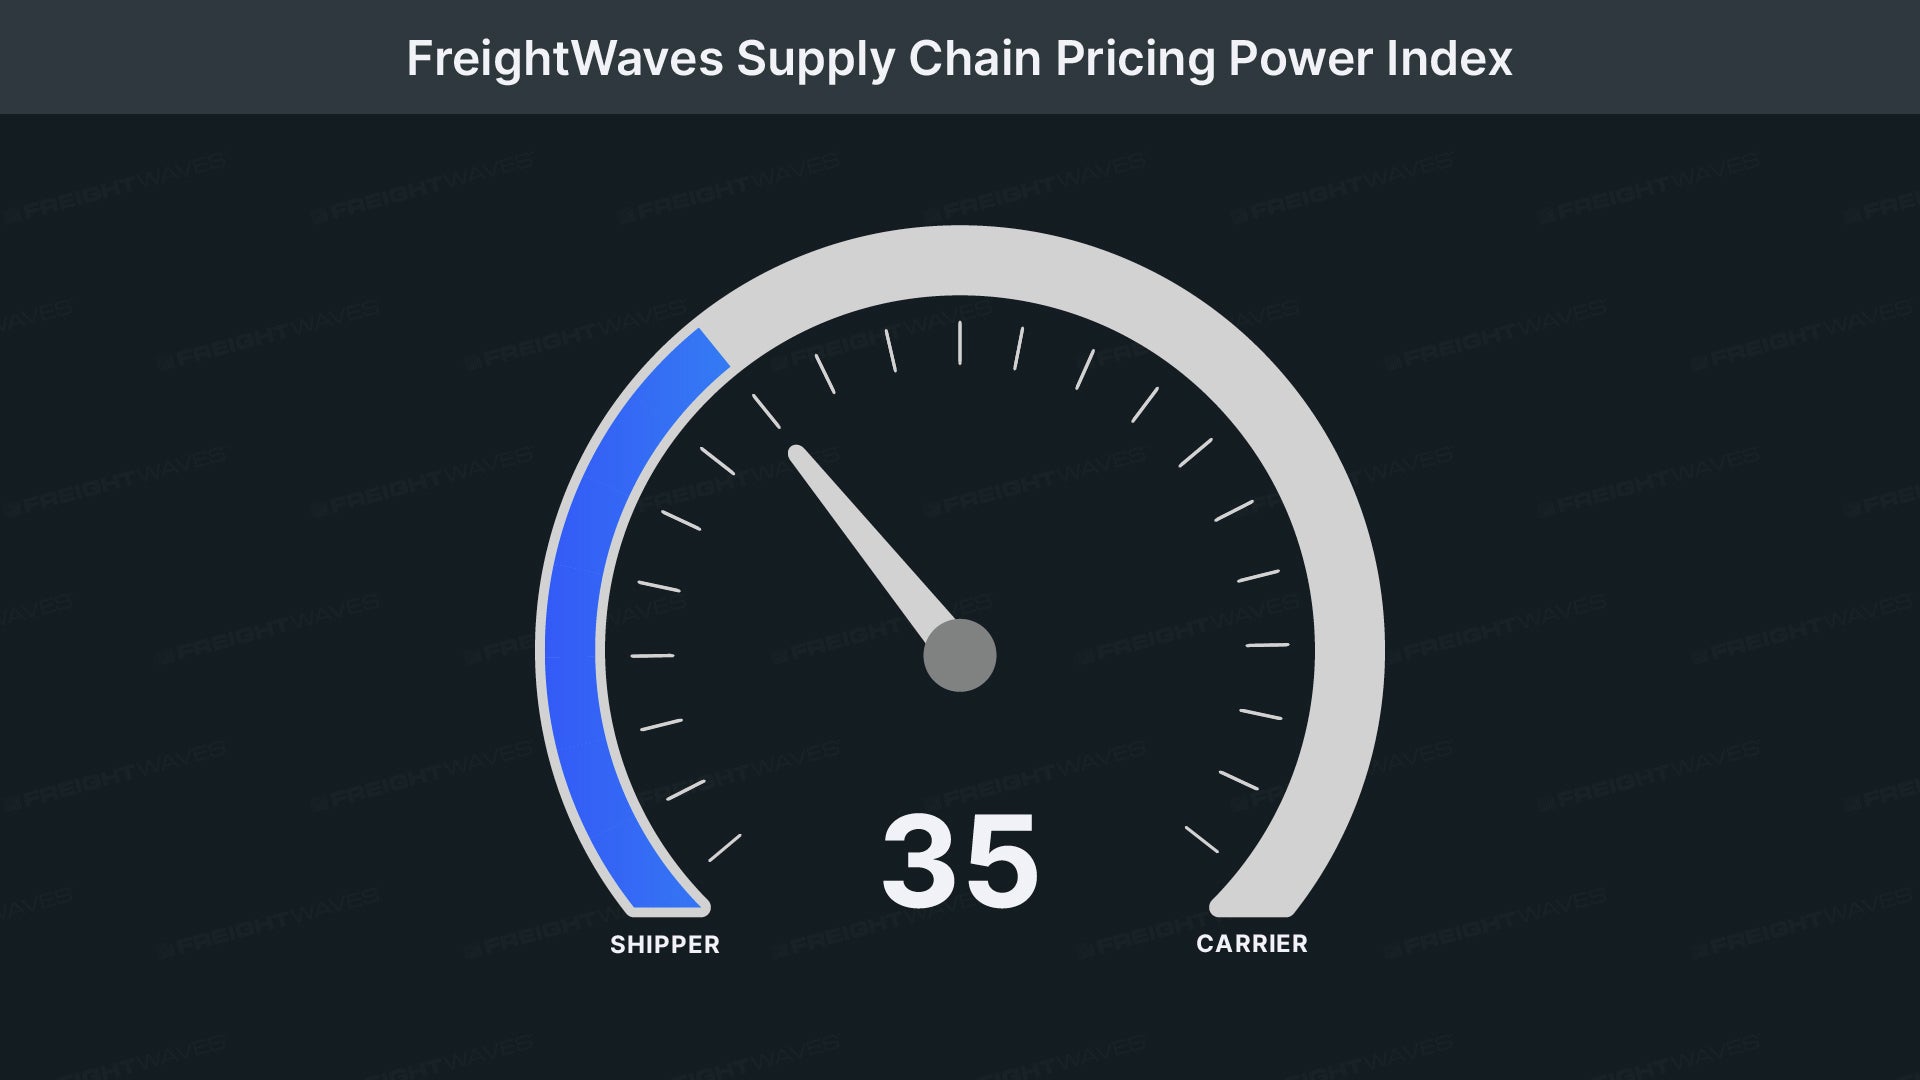
This Week’s FreightWaves Supply Chain Price Power Index: 35 (Shipper)
Last Week’s FreightWaves Supply Chain Price Power Index: 35 (Shipper)
Three-Month Forecast for the FreightWaves Supply Chain Price Power Index: 40 (Shipper)
The FreightWaves Supply Chain Price Power Index uses analysis and data from FreightWaves SONAR to analyze market conditions and estimate shippers’ negotiating power over rates with carriers.
This week’s Price Power Index is based on the following indicators:
Freight Volumes Continue Under Pressure
The strike by the International Longshoremen’s Association (ILA) lasted shorter than many expected, only three days. Despite its brief duration, freight volumes across various domestic modes of transportation remained low in early October.
A national measure of freight demand, the Outbound Tender Volume Index (OTVI), decreased 0.43% month-over-month, marking a third consecutive week of decline. OTVI was negative year-over-year at the beginning of the year but has now turned positive again. Currently, OTVI is up 3.63% year-over-year.
The Contract Load Acceptance Volume (CLAV) measures the volume of accepted loads under contractual agreements. Observing tender acceptance volumes, we see a decrease of 1.02% month-over-month. This larger decline compared to overall OTVI is due to an increase in tender rejections over the past week.
The latest credit and debit card spending report from Bank of America shows little growth in September’s spending. In the week ending September 28, total credit card spending increased by only 0.3% year-over-year. Spending in discretionary categories was low, particularly in online electronics and furniture, which decreased by 13% and 7%, respectively.
With freight volumes across the market falling from their Labor Day highs, most national markets reported a week-over-week decline in freight volumes. Among the 135 freight markets tracked by FreightWaves SONAR, only 59 had higher freight volumes this week compared to last week, down from 63 the previous week.
Growth was mostly seen in smaller freight markets, where any increase appears more significant relative to the overall market. However, there was one exception to this trend this week: the Joliet market in Illinois, one of the largest markets near Chicago, saw a 4.79% increase in freight volumes.
In port markets directly affected by the ILA strike, volume generally declined. In Houston, outbound volume decreased by 4.61%. In Elizabeth, New Jersey, volume dropped by 13.52%. In Baltimore, volume fell by 8.74%. As terminal operations reopened on Friday and port workers returned to their posts, this will help restore volumes in these markets, but it may take time to clear the queues that have begun to build up.
By Mode: The dry van market has continued to slow over the past week. Dry van outbound tender volume index decreased by 0.54%. Affected by movements from the previous week, dry van freight volumes are now down 0.2% year-over-year.
Cooler freight volumes have significantly declined in the past week, reaching their lowest levels since late May. The refrigerated truck outbound tender volume index dropped by 3.85%, one of the most severe weekly declines outside of holiday-affected weeks. After briefly turning positive at the end of September, refrigerated freight volumes are now down 2.14% year-over-year.
Rejection Rates Now Higher Than Labor Day
The strike had a small impact on capacity but rejection rates increased this week, easing from their low levels at the end of September. Despite slight increases, rejection rates remain below 5%. The minor fluctuations this week are positive signals for the market and could indicate some positive signs for the second half of Q4.
The Outbound Tender Rejection Index (OTRI), a relative measure of capacity, rose to 4.96%, an increase of 56 basis points, reversing and surpassing Labor Day levels. OTRI is now 45 basis points higher than last year, indicating that although the market feels less tight with rejection rates still below 5%, overall rejection rates are rising. Rejection rates are returning to pre-2019 levels, now only 34 basis points lower compared to the same period in 2019, down from 82 basis points last week.
The chart above shows changes in OTRI across 135 national markets on a weekly basis. Blue areas indicate markets where tender rejection rates increased over the past week, while red indicates decreases. The more vibrant the color, the greater the change.
Among the 135 markets, only 78 reported higher rejection rates in the last week, a significant increase from 40 the previous week.
The largest national increases were still seen in smaller freight markets with lower outbound volumes, such as Bismarck and Fargo in North Dakota, where rejection rates increased by 1,208 and 800 basis points, respectively. Given the size of these freight markets, their impact on overall freight market dynamics is not significant.
The largest changes in rejection rates occurred in larger markets like Chicago and Atlanta. In Atlanta, rejection rates rose by 76 basis points over the past week but remain relatively low at only 3.6%. In Chicago, tender rejection rates increased by 89 basis points to reach above 5%, now standing at 5.08%.
By Mode: Rejection rates in all trucking markets for various equipment types have risen this week. Dry van market rejections saw the smallest increase among different equipment types, which makes sense given its size as the largest type. The dry van outbound tender rejection index rose by 55 basis points to reach 4.74%, up 30 basis points from last year.
Rejection rates in the refrigerated market climbed back above 10%, a significant level for overall market dynamics. Over the past week, the refrigerated truck outbound tender rejection index increased by 169 basis points to reach 10.72%. Refrigerated rejections are now up 320 basis points from last year.
The flatbed market is recovering from summer challenges as rejection rates have risen since the initial rate cut announcement. Additionally, Hurricane Helene’s destruction in the southeastern region will create more project freight opportunities as communities begin rebuilding. Over the past week, the flatbed outbound tender rejection index increased by 168 basis points to reach 8.34%. Flatbed rejections are now up 179 basis points from last year.
Spot Rates Rebound at Start of Q4
With slight increases in rejection rates and challenges posed by the closure of Interstate 26 and 40 in the southeast, spot prices have slightly increased at the start of Q4.
This week, the National Trucking Index (NTI), which includes fuel surcharges and various other fees, recovered some losses from last week, rising three cents to $2.23 per mile. NTI is now 6 cents or 2.6% lower year-over-year. The increase in NTI’s linear variant (excluding fuel surcharges and other additional charges) was more significant, increasing by four cents to reach $1.68 per mile, wiping out all declines from last week. NTIL is up nine cents per mile compared to the same period last year. The difference between NTIL and NTI lies in fuel changes; diesel prices were significantly higher in 2023 than they are now. The average spot price for diesel trucks is down $0.96 or 21% from last year.
Initially reported dry van contract rates have remained within a relatively tight range, stabilizing at $2.31 per mile over the past week. Throughout 2024, contract rates have been in a tight range, indicating that extreme cost savings are now history and service is becoming more of a focus. Initially reported contract rates are down seven cents or 2.9% year-over-year.
The chart above shows the gap between NTIL and dry van contract rates returning to pre-pandemic levels. The gap remains historically wide and has widened in recent weeks, deviating from the gradual approach to pre-pandemic averages seen throughout the year. Significant disruptions can quickly narrow this gap because spot rates react faster; therefore, it is not surprising to see the gap narrowing during Q4’s peak road freight season. The question lies in how much the gap narrows and whether it will be sustainable, especially if Q1 2025 sees traditional declines in freight demand.
The FreightWaves Supply Chain Price Power Index along the lane shows a spot rate increase of 14 cents to $2.55 per mile, now down 21 cents from contract rates.
Tony Mulvey
Tony Mulvey has joined the FreightWaves team, focusing on producing multimodal research reports for the transportation industry. Before joining FreightWaves, Tony earned a Bachelor’s degree in Economics from the University of Tennessee.
Source: FreightWaves