Skip to content

Manufacturing

Analysis

India’s Industrial Production Rises 8% in August 2026

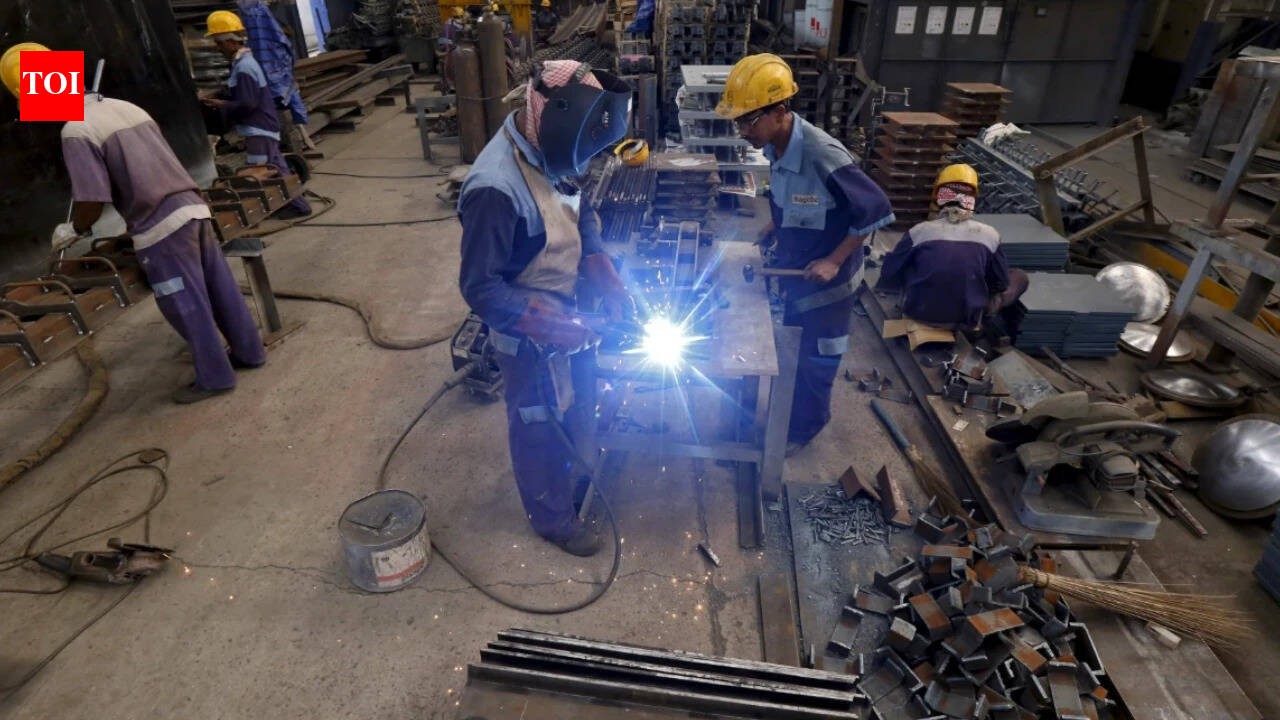
India's industrial production rose 8% year-on-year in August 2026, accelerating from 7.4% in July. Manufacturing grew 9%, electricity and gas supply surged 12.3%, and mining contracted 5.6%. Electrical equipment output jumped 30.9%, while capital goods rose 16.9% and intermediate goods increased 13.7%. Cumulative growth for April–August 2026 reached 6.7%, up from 4.2% a year earlier. August data is based on an 88% response rate and remains provisional.

Original source: Source information pending

India’s Industrial Production Rises 8% in August 2026

According to timesofindia.indiatimes.com, India’s industrial production grew 8 per cent year-on-year in August 2026, accelerating from the revised 7.4 per cent growth recorded in July, as reported by the Ministry of Statistics and Programme Implementation (MoSPI).

Strong Sectoral Performance Drives IIP Gains

The Index of Industrial Production (IIP) reached an index level of 123.3 in August, up from 114.2 in the same month a year earlier. The National Statistics Office stated:

“In August 2026, Index of Industrial Production recorded an 8.0 per cent year-on-year growth, supported by 9.0 per cent growth in Manufacturing sector and strong growth of 12.3 per cent in Electricity & Gas Supply sector.”

Manufacturing — the largest-weighted component of the IIP — expanded 9 per cent in August and has maintained growth of 8 per cent or more for three consecutive months. Electricity and gas supply output rose 12.3 per cent, while water supply, sewerage and waste management grew 6.3 per cent. Mining and quarrying contracted 5.6 per cent.

High-Growth Industry Groups and Use-Based Classification

Within manufacturing, 18 of the 23 industry groups posted positive year-on-year growth in August. The manufacture of electrical equipment led with 30.9 per cent growth, followed by other transport equipment at 25.3 per cent and motor vehicles, trailers and semi-trailers at 25.2 per cent. The ministry attributed motor vehicle growth to strong performance across auto components, spares and accessories, passenger cars, and commercial vehicles.

Under the use-based classification, capital goods output increased 16.9 per cent, intermediate goods rose 13.7 per cent, consumer durables climbed 11.1 per cent, and infrastructure and construction goods grew 6.4 per cent. Primary goods advanced 3.5 per cent, while consumer non-durables rose only 2.1 per cent. Intermediate goods, capital goods, and consumer durables were the top three contributors to overall IIP growth.

Year-to-Date Trends and Data Reliability

Cumulative industrial production growth for April–August 2026 stood at 6.7 per cent, compared with 4.2 per cent in the corresponding period a year earlier. The August quick estimates were compiled with an 88 per cent weighted response rate, while the July final estimates were based on a 93.4 per cent response rate. The MoSPI noted that August figures are subject to revision in subsequent releases.

Source: timesofindia.indiatimes.com

Compiled from international media by the SCI.AI editorial team.
Ask SCI.AI Finished reading? Continue with SCI.AI. Explore the related policy, route, company and historical context. Continue asking
Van Freight Rejection Rate Hits 14% Amid Capacity Fragility
Manufacturing

Van Freight Rejection Rate Hits 14% Amid Capacity Fragility

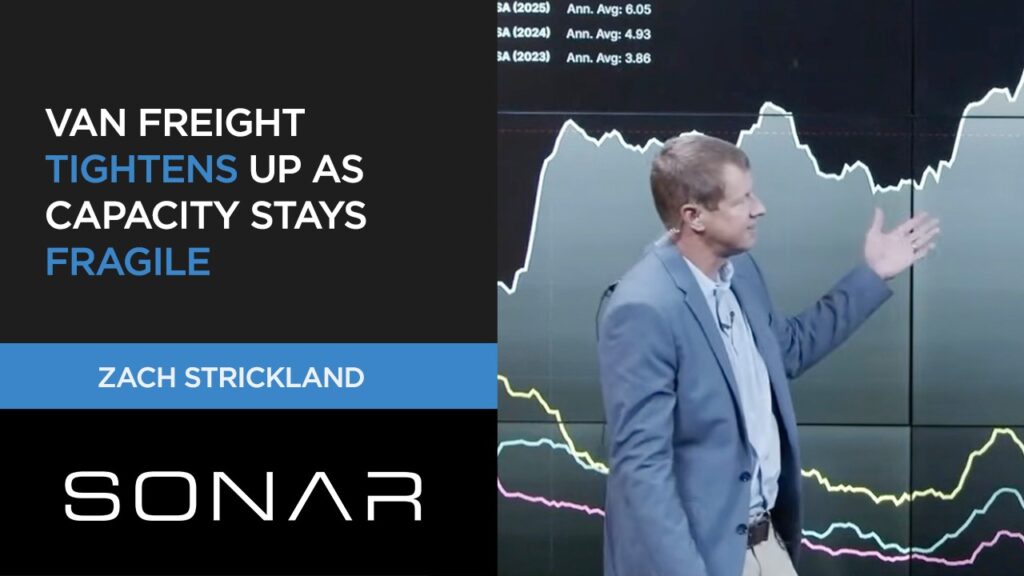
The national Tender Rejection Index reached 14%, with van freight — representing 60%–70% of U.S. freight volume — driving sustained upward pressure. According to FreightWaves’ Zach Strickland, capacity fragility—not demand growth—is the root cause, as tender volumes remain below April levels. Refrigerated rejections sit at 20%, flatbed at 19%, and van rejections are most consequential due to volume share. The Midwest corridor, especially Joliet and Columbus, is the geographic epicenter. Spot rates are rising nationally, with only Atlanta and Greenville showing softness. Diesel cost pass-through is occurring only because capacity constraints enable it.

Hapag-Lloyd cuts QFP capacity up to 40% amid Asia disruption
Manufacturing

Hapag-Lloyd cuts QFP capacity up to 40% amid Asia disruption

Hapag-Lloyd has cut Quality Freight Product (QFP) capacity allocations by up to 40%, according to a forwarder speaking to theloadstar.com on 24 September 2026. Launched in 2021, QFP binds customers and carrier to volume and space commitments, with penalties for non-compliance. The forwarder estimates 93% of Hapag-Lloyd’s eastbound transpacific volume is locked in QFP, limiting spot-market flexibility. Cuts — applied across the board after Labour Day 2026 — stem from operational disruption in China and the Panama Canal. A QFP reconciliation is pending, and Hapag-Lloyd has acknowledged it may need to reconsider the product’s design.

Container Ship Orderbook Surges to 45% of Fleet
Manufacturing

Container Ship Orderbook Surges to 45% of Fleet

The global containership orderbook has surged to 45% of the existing fleet — its highest level since 2009 — with 1,925 vessels (15.6 million teu) on order, more than double the 7.6 million teu post-pandemic peak. Five carriers, including Hai An Transport (368%) and Regional Container Lines (157%), now have orderbooks exceeding their current fleets. Maersk, MSC, CMA CGM, and COSCO collectively hold orderbooks ranging from 35% to 52% of their fleets, prompting Sea-Intelligence to warn of an impending 'commercial battle' as new ships arrive. A concurrent return of Asia–Europe sailings via Suez threatens to further flood the market with released capacity.

Welcome Back!

Login to your account below

Create New Account!

Fill the forms below to register

Retrieve your password

Please enter your username or email address to reset your password.

Scan to share via WeChat

Open WeChat and scan the QR code to share

QR Code

Add New Playlist