The Surface Calm Masks Structural Turbulence
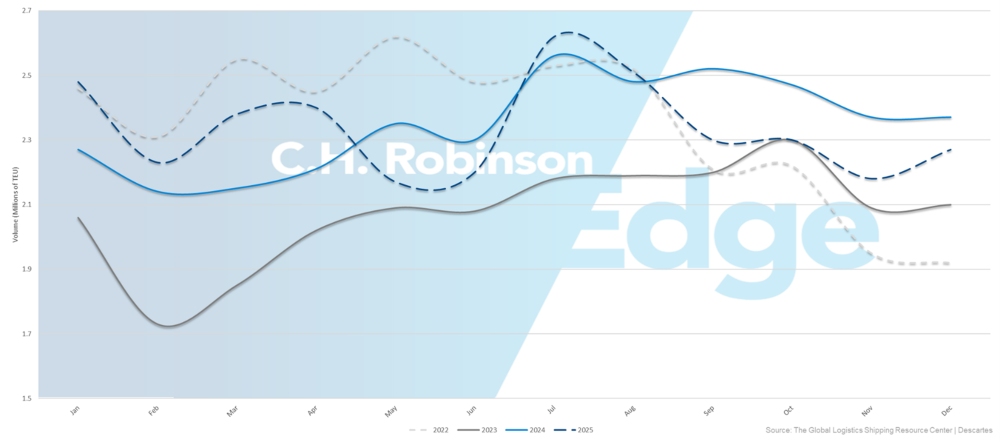
At first glance, February 2026’s ocean freight market presents an image of remarkable composure—no explosive rate spikes, no port-wide shutdowns, no headlines screaming of systemic collapse. Yet this veneer of stability is profoundly deceptive, concealing a complex lattice of interlocking pressures that are redefining the very architecture of global container logistics. The apparent tranquility stems not from equilibrium but from deliberate, almost surgical, carrier intervention—primarily through aggressive capacity discipline—and from shippers’ anticipatory behavior rather than organic demand normalization. Crucially, this calm is highly contextual: it holds true for headline spot rates on major East-West corridors, but fractures dramatically when examined through the lenses of schedule reliability, inland infrastructure stress, and regional port performance divergence. The December 2025 U.S. container imports of ~2.2 million TEU, while down 5.9% year-on-year, still ranked as the fourth-strongest December on record—a sobering reminder that even ‘softening’ volumes remain historically elevated. This paradox underscores a fundamental shift in industry dynamics: the market is no longer governed by simple supply-demand elasticity but by a sophisticated, multi-layered game of temporal arbitrage, network optimization, and risk mitigation. Carriers have moved decisively beyond reactive blank sailing to proactive, algorithmically driven capacity calibration—reducing sailings by 30–45% post-Lunar New Year not as a panic measure, but as a strategic tool to prevent rate erosion during seasonally weak periods. This discipline, however, carries profound second-order consequences: it compresses the operational safety margin across the entire network, turning minor disruptions—like a single delayed feeder vessel in Singapore or a snowstorm in Hamburg—into cascading delays that ripple across continents and weeks.
This recalibration of expectations is perhaps the most critical yet under-discussed development. Shippers and logistics managers are being forced to abandon legacy mental models rooted in predictable lead times and linear transit paths. Instead, they must now operate within a probabilistic framework where every decision—from selecting a specific service string to determining buffer inventory levels—carries quantifiable reliability risk. The industry’s collective memory of pre-pandemic predictability has become a liability; those clinging to historical averages for transit time or equipment availability are increasingly exposed to costly exceptions. For instance, the fact that full-year 2025 volumes were only 0.4% lower than 2024, despite near double-digit growth earlier in the year, reveals a market that has plateaued at a structurally higher baseline—not a return to pre-2021 norms. This plateau reflects enduring shifts: nearshoring acceleration, inventory strategy maturation (moving from panic-stocking to demand-signal-driven replenishment), and the permanent embedding of resilience premiums into procurement decisions. Consequently, the ‘calm’ of February 2026 is less a return to normalcy and more the emergence of a new, more volatile, and far more complex normal—one where volatility is managed not by suppressing it, but by making it visible, measurable, and insurable through contractual and technological means.
Lunar New Year as a Catalyst, Not a Calendar Event
Lunar New Year (LNY) in 2026 falls on February 17—a date that has long served as a predictable inflection point in the global shipping calendar. Yet its role has evolved dramatically from a simple seasonal pause into a powerful, self-fulfilling market catalyst that actively reshapes supply chain behavior months in advance. The traditional narrative—that factories shut down and trade slows—has been superseded by a far more sophisticated and disruptive phenomenon: massive, coordinated front-loading. Shippers, acutely aware of the 30–45% reduction in carrier sailings post-LNY, are no longer waiting for the holiday to begin; they are racing to secure space and move goods well before the official start date. This creates intense, short-duration pulses of demand that overwhelm inland infrastructure precisely when it is least prepared to absorb them. Drayage fleets face acute chassis shortages not because of chronic underinvestment alone, but because their utilization patterns have been violently compressed into narrow windows. Distribution centers experience ‘inventory avalanches’—sudden surges of inbound containers that exceed receiving dock throughput, leading to dwell-time penalties, storage cost inflation, and labor scheduling chaos. Critically, this front-loading is no longer confined to consumer goods; it has permeated industrial sectors, including automotive components and semiconductor packaging materials, where just-in-time (JIT) philosophies are colliding with geopolitical reality. The result is a dangerous misalignment: while ocean carriers optimize for predictable, low-volume periods post-LNY, the land-side ecosystem is engineered for steady-state flow, not hyper-compressed, high-velocity bursts. This mismatch is the primary driver behind the widening gap between scheduled and actual arrival windows—a gap that is no longer measured in days but in weeks for certain transshipment-dependent routes.
Furthermore, the LNY effect is now deeply entangled with other regional cultural events, creating overlapping layers of disruption. The Brazil Carnival, occurring on February 16–17, directly coincides with the LNY peak, effectively creating a ‘double-barreled’ capacity shock on the Asia-South America corridor. Carriers cannot simply divert vessels from one region to another; the specialized nature of trade lanes, port infrastructure, and even crew certifications means that capacity reductions in Asia are not fungible with needs in Santos or Itajaí. This confluence forces shippers to make impossible choices: prioritize North American deliveries and accept South American delays, or vice versa—neither option aligning with integrated global production schedules. The implications for multinational corporations with complex, multi-continent supply networks are profound. A Tier-1 automotive supplier sourcing steel coils from China, machining them in Mexico, and assembling final modules in Ohio cannot treat these legs as independent transactions. A three-day delay in Shanghai-to-Manzanillo transshipment due to LNY front-loading can cascade into a five-day line stoppage in Toledo if buffer stocks are insufficient. Thus, LNY has ceased to be a discrete event and has become a permanent feature of supply chain risk modeling—a variable that must be stress-tested in every scenario plan, with financial impact assessments attached to every day of potential delay. This represents a paradigm shift from reactive crisis management to embedded, continuous risk anticipation.
The Suez Canal Fracture: A Permanent Network Schism
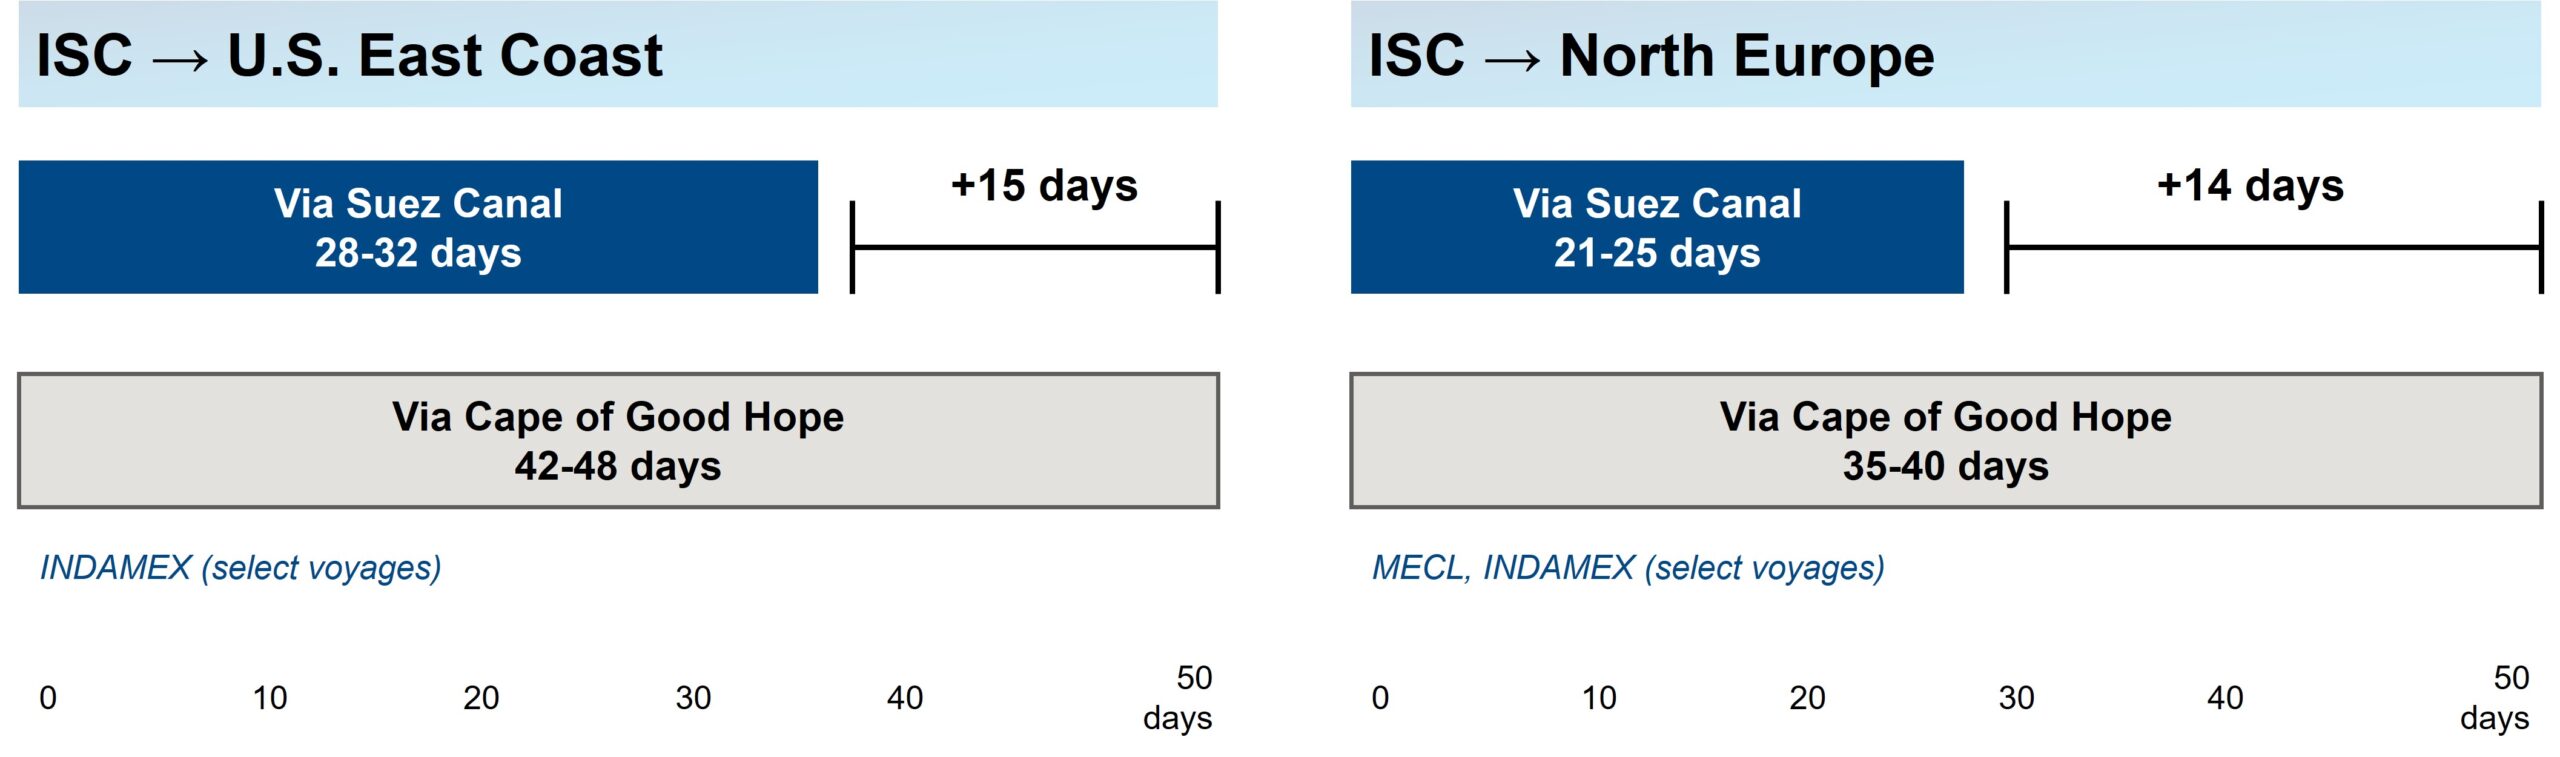
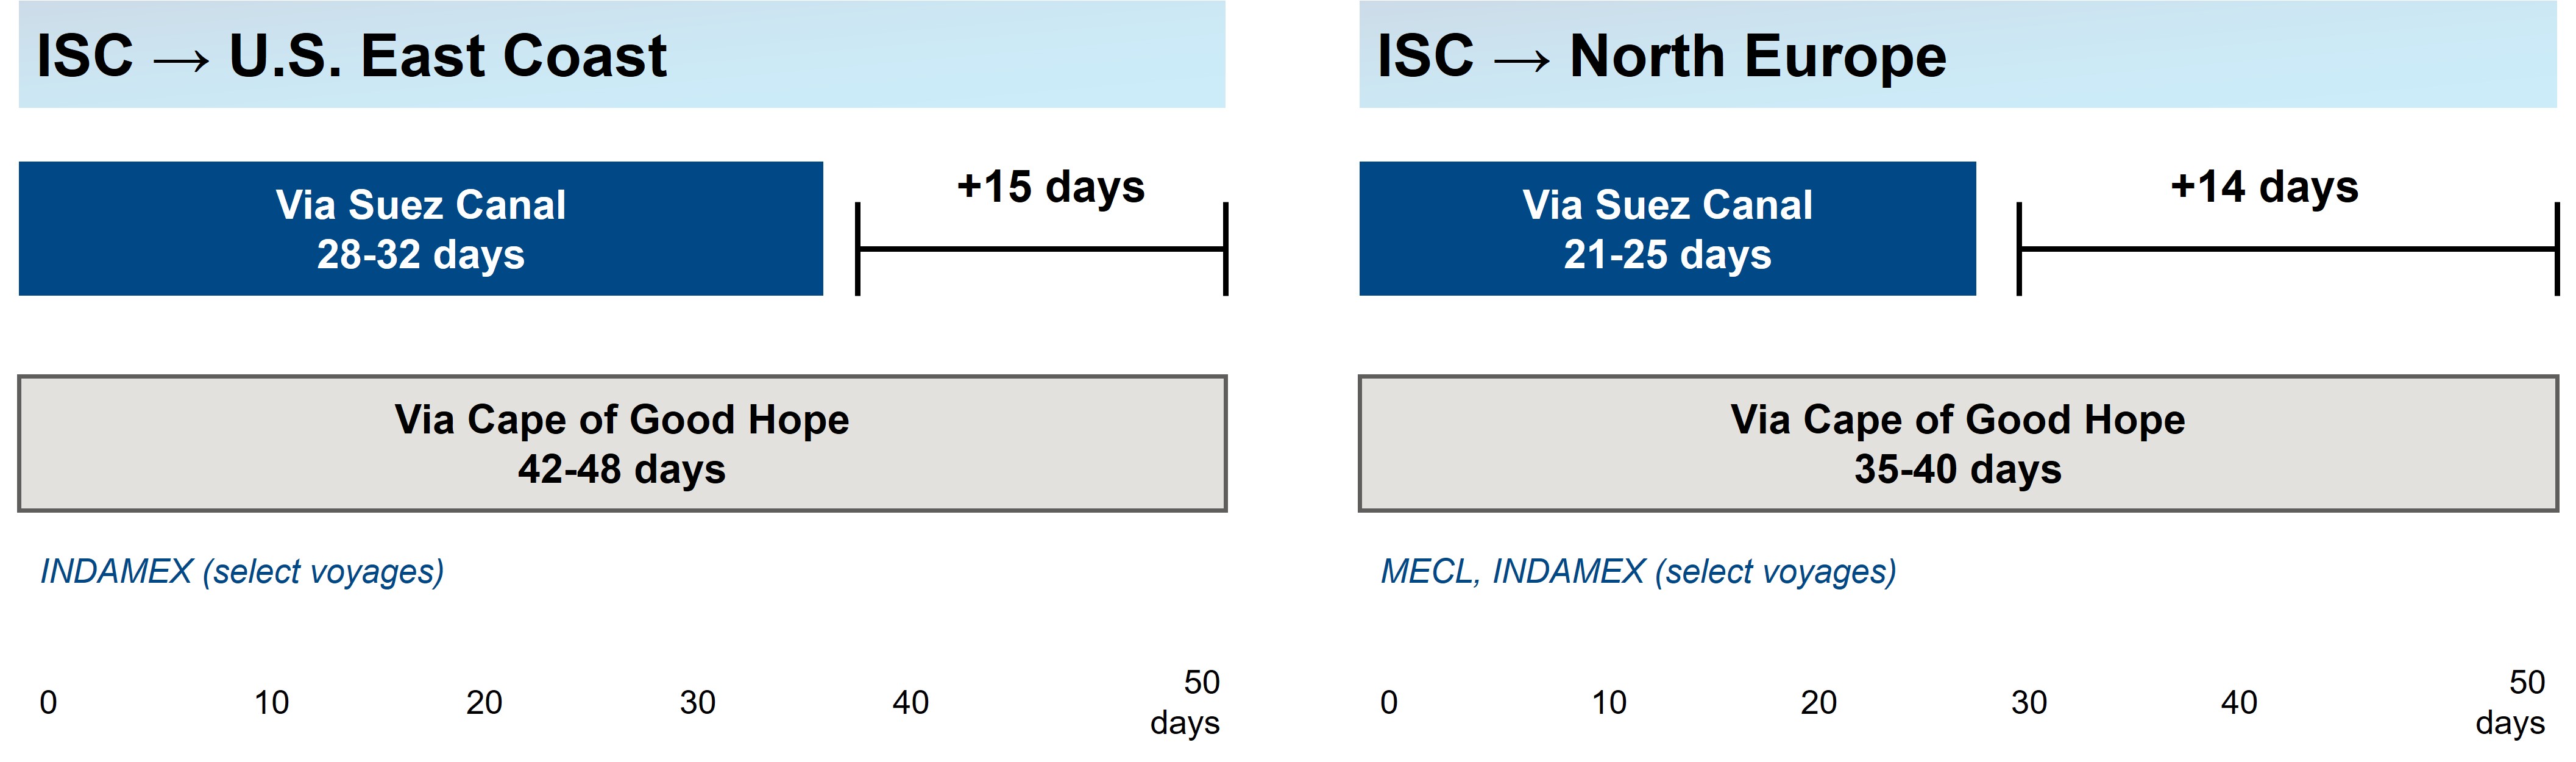
The decision by some carriers to resume transiting the Suez Canal while others maintain the Cape of Good Hope route is not a temporary tactical adjustment but the crystallization of a deep, strategic schism in global maritime network design. Services like CMA CGM’s INDAMEX and Maersk’s MECL are betting on the long-term viability and cost efficiency of the Suez route, accepting its heightened security and political risk premium in exchange for significantly reduced transit times and fuel consumption. Conversely, carriers maintaining the Cape route are prioritizing absolute predictability and insurance certainty over speed, acknowledging that the Suez’s vulnerability to geopolitical flashpoints—whether Houthi attacks, Egyptian regulatory shifts, or Red Sea environmental incidents—introduces an unacceptable level of schedule variance for their core customer segments. This divergence is not arbitrary; it reflects fundamentally different value propositions. The Suez-reliant services cater to shippers for whom time-in-transit is the dominant cost driver—think high-value electronics, perishable pharmaceuticals, or fast-fashion replenishment. The Cape-reliant services serve industries where cargo integrity, consistent documentation, and minimal exception handling are paramount—such as heavy industrial machinery, project cargo, or regulated chemicals. The transit time differential illustrated in the comparative chart—which shows stark variations depending on the chosen path—is thus less a data point and more a strategic signpost, signaling which segment of the market a carrier intends to dominate.
This schism has profound implications for the entire logistics ecosystem. For freight forwarders and NVOCCs, it necessitates a complete overhaul of quoting and booking systems. A simple origin-destination pair (e.g., Shanghai to Rotterdam) is no longer sufficient; quotes must now specify the exact service string, its routing history, its transshipment points, and its documented reliability score over the past 90 days. For shippers, it demands a radical rethinking of service-level agreements (SLAs). A blanket ’14-day transit time’ clause is obsolete; contracts must now define acceptable variance bands, specify remedies for missed windows, and allocate responsibility for delays originating from routing decisions made solely by the carrier. Most critically, it erodes the concept of a unified ‘global ocean network.’ What exists instead is a fragmented archipelago of semi-autonomous service ecosystems, each with its own risk profile, cost structure, and operational rhythm. This fragmentation increases complexity exponentially: a single shipment moving from Guangzhou to Chicago might involve a Suez-bound vessel to Rotterdam, followed by a rail leg to Antwerp, then a feeder to Le Havre, and finally a transatlantic crossing—all requiring separate coordination, documentation, and contingency planning. The era of the monolithic, predictable ocean lane is over; in its place stands a dynamic, multi-speed, and inherently uncertain network where the choice of routing is the single most consequential logistical decision a shipper can make.
Transshipment Hubs: The Unseen Bottlenecks
While headlines focus on mega-ports like Los Angeles or Rotterdam, the true pressure points in February 2026’s ocean market lie hidden within the intricate web of transshipment hubs—Singapore, Port Klang, Colombo, and Algeciras. These nodes, designed to be efficient connectors, have instead become critical chokepoints whose congestion radiates delays across entire service strings. Unlike primary gateways, where congestion is often visible and quantifiable (e.g., vessel queues at anchorages), transshipment delays are opaque and systemic. A single delayed feeder vessel arriving at Singapore from Ho Chi Minh City can hold up three mother vessels bound for Europe, North America, and the Mediterranean, each carrying thousands of TEUs destined for dozens of final ports. The ripple effect is exponential: a 24-hour delay in Singapore can translate into a 72-hour delay in Hamburg, a 96-hour delay in Newark, and a 120-hour delay in Savannah—not because of problems at those ports, but because of a failure at the nexus. This opacity makes it exceptionally difficult for shippers to diagnose root causes or assign accountability. When a container misses its connection, is the fault with the feeder operator, the terminal’s yard crane productivity, the customs clearance process, or the carrier’s poor slot allocation? The answer is rarely singular, and the lack of transparent, real-time data sharing across these multi-carrier, multi-terminal ecosystems prevents effective problem-solving.
The congestion at these hubs is not merely a function of volume; it is a symptom of a deeper architectural flaw in the current network model. The industry’s relentless pursuit of economies of scale—building ever-larger vessels—has concentrated immense volumes onto fewer, larger ships, which then require massive, centralized transshipment facilities to distribute cargo efficiently. However, the supporting infrastructure—terminal cranes, yard space, road and rail connections, and customs processing capacity—has not scaled at the same pace. Singapore, for example, operates at near 98% berth utilization during peak weeks, leaving zero margin for recovery from weather events or mechanical failures. Similarly, Port Klang’s reliance on a single deep-water terminal for ultra-large container vessels (ULCVs) creates a single point of failure that can paralyze an entire service loop. This structural vulnerability is exacerbated by the divergent carrier routing strategies discussed earlier. Carriers using the Suez route concentrate more volume through Singapore and Colombo, while those using the Cape route overload Algeciras and Tangier Med. The result is not balanced network load but acute, localized overcapacity. For supply chain planners, this means that transit time estimates must now include not just the voyage duration but a statistically derived ‘transshipment risk premium’—a buffer calculated from historical connection success rates at specific hub-port combinations. Ignoring this premium is the single most common cause of JIT inventory failures in 2026.
North American Inland Infrastructure: The Silent Crisis
Beneath the surface-level stability of February’s ocean market lies a simmering crisis in North America’s inland transportation infrastructure—a crisis that is both a consequence of oceanic decisions and a primary driver of growing unreliability. The front-loading phenomenon, while rational from a shipper’s perspective, acts as a hydraulic shockwave that propagates inland, overwhelming systems engineered for steady-state flow. Drayage, the critical first-and-last-mile link between ports and distribution centers, is experiencing unprecedented strain. Chassis shortages, once a periodic annoyance, have become a chronic, systemic constraint. The reason is twofold: first, the compressed timing of container arrivals means chassis are tied up for shorter durations but at much higher peak intensity, preventing natural turnover; second, the geographic dispersion of demand has increased. With LNY front-loading, containers aren’t just arriving in LA/LB—they’re flooding into Savannah, Charleston, and Houston simultaneously, stretching the national chassis pool thin across multiple regions. This isn’t a shortage of equipment per se, but a catastrophic misalignment of equipment location and temporal demand. The result is a vicious cycle: shippers pay premium drayage rates to secure scarce chassis, which incentivizes drayage companies to hoard equipment for high-paying customers, further reducing overall fleet availability and driving rates even higher.
Simultaneously, distribution networks are buckling under the weight of ‘inventory avalanches.’ Warehouses and fulfillment centers, optimized for lean inventory and rapid throughput, are inundated with containers arriving in tightly bunched waves. Dock doors are booked solid for days in advance, forcing trucks to wait in lengthy queues—sometimes for 24–48 hours—before unloading. This creates a secondary congestion layer: the port’s physical footprint may be clear, but its functional capacity is choked by trucks idling on access roads and in designated staging areas. Labor is another critical pinch point. Receiving teams, trained for a predictable 8-hour shift, are now required to work overtime or split shifts to handle the surge, leading to fatigue, errors in documentation, and increased safety incidents. The financial impact is staggering: detention and demurrage charges, once rare exceptions, have become routine line items on logistics invoices, often exceeding the base ocean freight cost. More insidiously, this inland stress is eroding the foundational principle of modern supply chains: visibility. When a container sits idle on a chassis for two days outside a warehouse, or when a pallet sits unscanned on a dock floor for 12 hours, the digital twin of that shipment—the data flowing through TMS and WMS platforms—becomes dangerously inaccurate. This data decay undermines every downstream decision, from demand forecasting to production scheduling, creating a feedback loop where poor data leads to poor decisions, which in turn create more operational chaos. The February 2026 market, therefore, is not just about ocean freight—it is a stark warning that the ocean is only the first link in a chain whose weakest point is increasingly found not on the water, but on the highway.
Toward a New Operating Model: Resilience as a Core Competency
The convergence of capacity discipline, routing divergence, transshipment fragility, and inland infrastructure stress signals the definitive end of the ‘efficiency-at-all-costs’ era in supply chain management. What is emerging in its place is a new operating model where resilience is not a supplementary capability but the central, defining competency. This is not resilience defined as passive redundancy—holding excess inventory or chartering backup vessels—but as active, intelligent, and data-driven adaptability. It requires a fundamental re-engineering of how companies source, plan, and execute logistics. At the strategic level, it means moving away from single-source, single-route procurement toward diversified, multi-modal, and multi-carrier contracting. A resilient shipper in 2026 does not lock in a single ocean service for a full year; instead, it maintains a portfolio of contracts—some with Suez-reliant carriers for speed-critical lanes, some with Cape-reliant carriers for stability-critical lanes, and some with air or rail options for true emergency response—each with clearly defined triggers for activation. This portfolio approach transforms risk from a binary threat into a manageable, quantifiable variable, similar to how financial institutions manage interest rate or currency risk.
Operationally, resilience demands unprecedented levels of data integration and predictive analytics. The widening gap between scheduled and actual arrival windows cannot be managed with static buffers; it requires dynamic, AI-powered forecasting that ingests real-time AIS data, port congestion indices, weather forecasts, and even social media sentiment from port communities to generate probabilistic arrival windows. These predictions must then be fed directly into ERP and APS systems to automatically adjust production schedules, inventory targets, and labor plans. The technology enablers exist—cloud-based TMS platforms, IoT-enabled container tracking, blockchain for immutable documentation—but adoption remains fragmented and siloed. The next frontier is not better point solutions, but seamless orchestration: a system that doesn’t just tell you a container is delayed, but automatically re-routes it, renegotiates drayage contracts, adjusts warehouse staffing, and notifies customers—all within minutes of the disruption being detected. Culturally, this shift requires breaking down the longstanding walls between procurement, logistics, finance, and operations. Finance departments must move beyond cost-per-TEU metrics to embrace total landed cost modeling that includes reliability premiums, buffer inventory costs, and exception handling expenses. Procurement must evaluate carriers not just on rate and capacity, but on their API maturity, data transparency, and collaborative problem-solving frameworks. Ultimately, the February 2026 market is not a temporary anomaly to be endured; it is the clearest possible signal that the future belongs to those who build supply chains not for maximum efficiency in stable times, but for maximum adaptability in perpetual uncertainty.
Source: chrobinson.ca