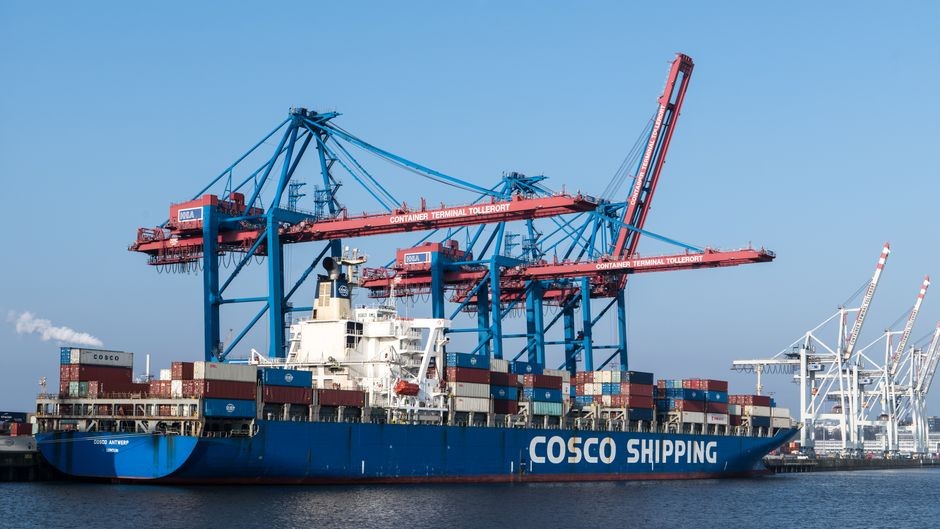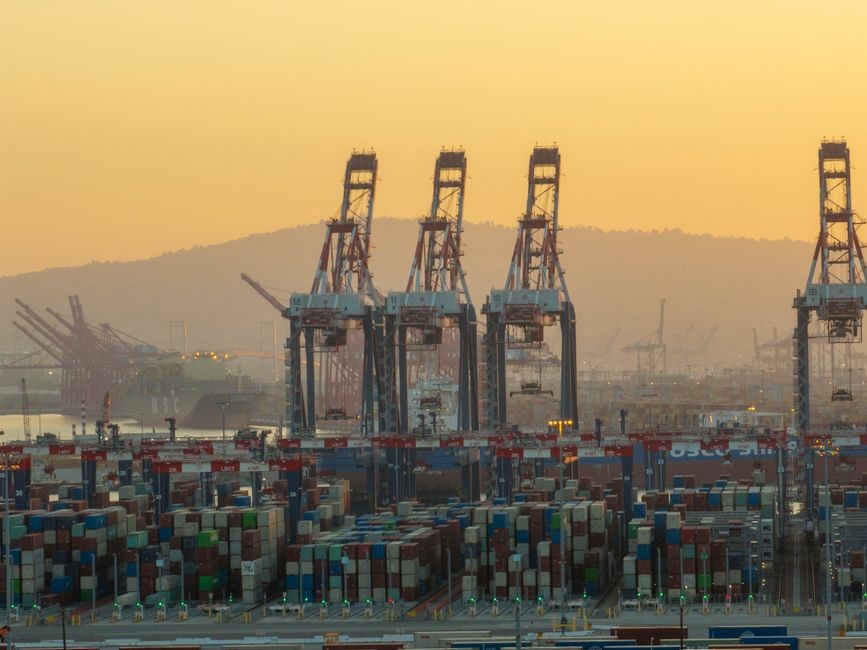
According to www.mckinsey.com, geopolitical distance fell sharply across major economies between 2017 and 2025 — by −12.7 percent for the United States, −11.2% for China, and −9.6 percent for the European Union — while total goods trade rose strongly, including +67.7% for ASEAN and +68.2% for Brazil over the same period.
Methodology and Data Scope
The McKinsey Global Institute (MGI) quantified geopolitical alignment using UN General Assembly voting records from 2005 to 2022, adapting a distance metric analogous to geographic proximity. This 2026 update analyzes 2025 trade data across ASEAN, Brazil, China, the European Union, India, and the United States — covering more than 90 percent of global trade. The report explicitly excludes Taiwan, Hong Kong, and Macao when referring to “China” unless otherwise stated.
The analysis accounts for well-documented discrepancies in bilateral trade statistics, citing differences in valuation methods, timing, reporting thresholds, and classification practices. To ensure regional accuracy, the report uses local trade data when presenting region-specific chapters or exhibits.
MGI’s prior research found that 10 percent by value of global trade is “globally concentrated” — meaning three or fewer economies supply over 90 percent of the globally traded volume for a given product. This concentration underscores systemic vulnerability in critical supply chains.
Import Reliance and Structural Shifts
Every major region relies on imports for more than 25 percent of its consumption of at least one critical resource, manufactured good, or service — a threshold confirmed across all assessed geographies. For example, Europe depends on imports for over 50 percent of its energy consumption, as shown in exhibit shading.
The report notes that tariff adjustments and realignment waves — including AI adoption and emerging market growth — rippled through global trade networks in 2025. In sectors where the United States shifted sourcing away from China toward alternative suppliers, prices rose by up to 9 percent, according to modeling cited in the report.
Meanwhile, the Western economic bloc — comprising the United States, the European Union, and allied partners — represents about 60 percent of global GDP. This scale enables coordinated development of new supplier relationships and markets within the group, mitigating some downside risk relative to the Eastern group in MGI’s modeling framework.
Research Leadership and Citations
The research was led by Jeongmin Seong, an MGI partner in Shanghai; Olivia White, a senior partner and director of MGI in San Francisco; Michael Birshan, a senior partner and member of the MGI Council in London; Sven Smit, a senior partner in the Amsterdam office and MGI chair; Camillo Lamanna, a McKinsey consultant in Sydney; and Tiago Devesa, an MGI senior fellow in Lisbon.
A January 12, 2023 MGI report titled “The complication of concentration in global trade” — co-authored by White, Woetzel, Smit, Seong, and Devesa — provides foundational analysis for the current findings. Additional context appears in “Global flows: The ties that bind in an interconnected world,” published by MGI in November 2022.
Source: McKinsey
Compiled from international media by the SCI.AI editorial team.