Explore

  • Trending
  • Latest
  • Tools
  • Browse
  • Subscription Feed

Logistics

  • Ocean
  • Air Cargo
  • Road & Rail
  • Warehousing
  • Last Mile

Regions

  • Southeast Asia
  • South Asia
  • Central Asia
  • Japan & Korea
  • Middle East
  • Europe
  • Russia
  • Africa
  • North America
  • Latin America
  • Australia
SCI.AI
  • Supply Chain
    • Strategy & Planning
    • Logistics & Transport
    • Manufacturing
    • Inventory & Fulfillment
  • Procurement
    • Strategic Sourcing
    • Supplier Management
    • Supply Chain Finance
  • Technology
    • AI & Automation
    • Robotics
    • Digital Platforms
  • Risk & Resilience
  • Sustainability
  • Research
  • Expert Columns
  • English
    • Chinese
    • English
No Result
View All Result
  • Login
  • Register
SCI.AI
No Result
View All Result
Home Technology AI & Automation

Roadcheck Week Drives Freight Rates Up 7%-9% — FreightWaves

2026/05/11
in AI & Automation, Disruptions, ESG & Regulation, Geopolitics, Logistics & Transport, Manufacturing, Procurement, Risk & Resilience, Supply Chain, Sustainability, Technology
0 0
Roadcheck Week Drives Freight Rates Up 7%-9% — FreightWaves

By Zach Strickland, FW Market Expert & Market Analyst | 2026-05-10

What Roadcheck Week Means for the Freight Market

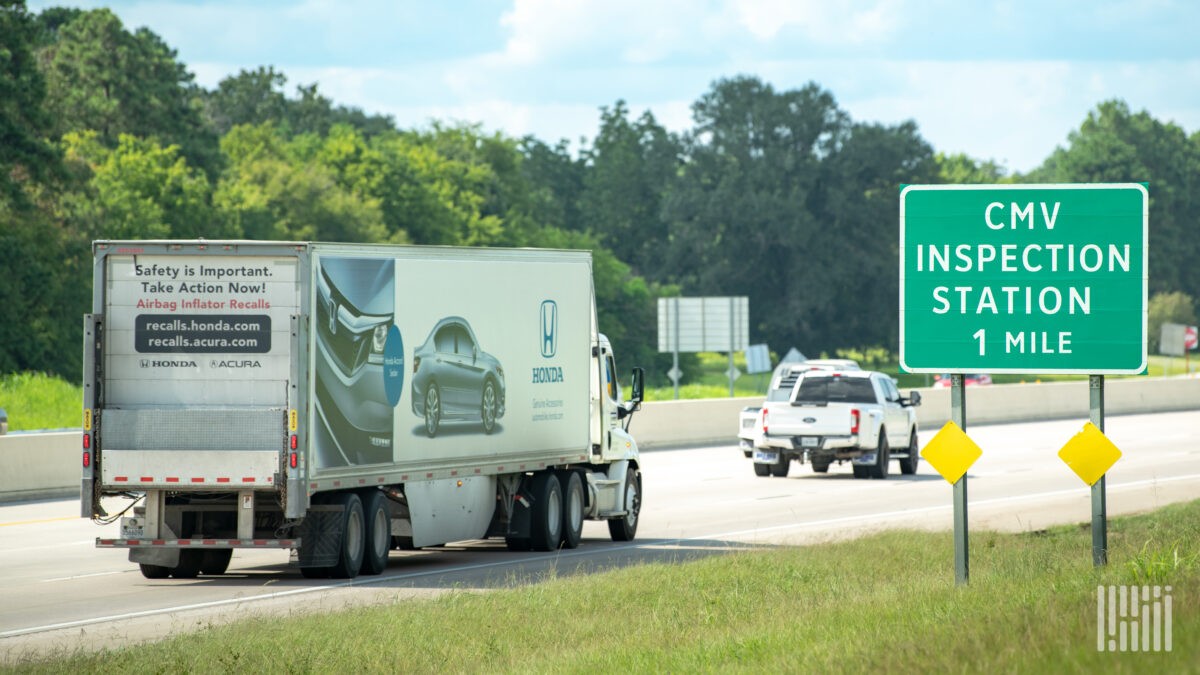
International Roadcheck is a 72-hour period when members of the Commercial Vehicle Safety Alliance (CVSA) conduct a heightened period of inspections on commercial vehicles. Since 2022, they have designated two primary areas of focus — one for the driver and one for the vehicle. Its impact on the domestic trucking market varies from a non-event (2020 did not produce a strong noticeable move in spot rates) to sharp 6-8% spikes in spot rates. This year’s period starts May 12 and focuses on ELDs and cargo securement.

Scale and Enforcement of Roadcheck

The CVSA states that International Roadcheck inspects nearly 15 trucks and motorcoaches every minute during the 72-hour period throughout North America, making it the largest targeted enforcement program on commercial motor vehicles in the world.

Inspection Data and Violation Trends

Last year, there were 56,178 inspections with a vehicle out-of-service (OOS) rate of 18.1% and a driver OOS rate of 5.9%. The vehicle inspection focus was tires, which accounted for 21.4% of vehicle OOS violations, while hours of service (HOS) — though not a focus area — led driver OOS violations at 32.4%. The falsified logs focus accounted for 10% of total driver OOS violations.

For context, Roadcheck week tire violations accounted for roughly 4.5% of the entire year’s tire violations in just three days. False RODS violations accounted for roughly 5% of the year’s total false log violations in less than 1% of the calendar year. The 56,000 inspections represent approximately 1.4% of total annual inspections across North America.

Market Impact and Capacity Reduction

So while this period does not represent a large share of annual OOS violations, the elevated OOS rate, heightened visibility, and concentrated enforcement do influence the market — as many drivers choose to avoid certain areas or take the week off, temporarily reducing capacity.

Differential Impact on Carriers

Roadcheck week does not affect all carriers equally. Larger fleets are generally more motivated to maintain compliance given the increased liability exposure they carry. Their scale makes them more susceptible to litigation when drivers or vehicles are found non-compliant. Smaller carriers and owner-operators carry less payout potential and are less likely to be involved in nuclear verdicts.

Tender data skews toward larger fleets given its reliance on electronic transmission infrastructure, which smaller carriers are less likely to have. So while tender rejection rates have increased just over a percentage point on average in recent years, this is driven more by the pull of elevated spot rates and increased load availability than by an actual reduction in capacity.

Recent Performance and Rate Trends

Last year’s inspection period started May 13 and produced one of the stronger increases in tender rejection rates for the period, with an approximately 117 basis point increase during the week. Rejection rates continued to climb heading into Memorial Day weekend, which complicates a clean analysis of Roadcheck’s standalone impact. Rejection rates increased from 4.48% on May 11 and peaked at 6.25% on May 25, with Memorial Day falling on May 26.

  • Dry van spot rates were the least responsive last year, increasing roughly 7%, including the Memorial Day effect.
  • Reefer had the strongest response at just under 9%.
  • Flatbed came in around 7.5% higher.

Separating Roadcheck’s influence from Memorial Day’s is difficult given the proximity of the two events.

Focus Areas and OOS Scope

It should be noted that not all inspection focus areas generate OOS violations — ABS systems in 2023 being one example. One of this year’s focus areas, cargo securement, has a relatively limited scope in terms of what can result in an OOS order.

Source: FreightWaves

Compiled from international media by the SCI.AI editorial team.

More on This Topic

  • 1 in 5 Trucks Unsafe — FreightWaves (May 11, 2026)
  • Vallarpadam Transhipment Halved, Vizhinjam Hits 1.3M TEU — The Loadstar (May 11, 2026)
  • Trump Pushes Nuclear-Powered Shipping: 1 Initiative (May 11, 2026)
  • Eagle Pass Trade Boom: $3.77B in March — FreightWaves (May 11, 2026)
  • Kraft Heinz Invests $600M in Supply Chain and Packaging Strategy (May 11, 2026)
ShareTweet

Related Posts

1 in 5 Trucks Unsafe — FreightWaves
AI & Automation

1 in 5 Trucks Unsafe — FreightWaves

May 11, 2026
3
Vallarpadam Transhipment Halved, Vizhinjam Hits 1.3M TEU — The Loadstar
AI & Automation

Vallarpadam Transhipment Halved, Vizhinjam Hits 1.3M TEU — The Loadstar

May 11, 2026
4
Trump Pushes Nuclear-Powered Shipping: 1 Initiative
AI & Automation

Trump Pushes Nuclear-Powered Shipping: 1 Initiative

May 11, 2026
2
Eagle Pass Trade Boom: $3.77B in March — FreightWaves
AI & Automation

Eagle Pass Trade Boom: $3.77B in March — FreightWaves

May 11, 2026
3
Kraft Heinz Invests $600M in Supply Chain and Packaging Strategy
Strategy & Planning

Kraft Heinz Invests $600M in Supply Chain and Packaging Strategy

May 11, 2026
3
Amplify Battery Plant Delay Pushes SOP to 2028 — www.ttnews.com
Manufacturing

Amplify Battery Plant Delay Pushes SOP to 2028 — www.ttnews.com

May 11, 2026
3

Leave a Reply Cancel reply

Your email address will not be published. Required fields are marked *

Recommended

40% of India’s Biodiesel Plants Lack UCO Aggregator Links

40% of India’s Biodiesel Plants Lack UCO Aggregator Links

11 Views
April 21, 2026
South American Supply Chain Transformation: The Rise of Nearsourcing and Logistics Hubs

South American Supply Chain Transformation: The Rise of Nearsourcing and Logistics Hubs

7 Views
April 3, 2026
Amazon rebrands 3PL arms into unified supply chain service

Amazon rebrands 3PL arms into unified supply chain service

4 Views
May 7, 2026
Beyond China Plus One: How Asia’s Supply Chain Reconfiguration Is Forging Regional Resilience by 2026

Beyond China Plus One: How Asia’s Supply Chain Reconfiguration Is Forging Regional Resilience by 2026

48 Views
March 18, 2026
Show More

SCI.AI

Global Supply Chain Intelligence. Delivering real-time news, analysis, and insights for supply chain professionals worldwide.

Categories

  • Supply Chain Management
  • Procurement
  • Technology


  • Risk & Resilience
  • Sustainability
  • Research

© 2026 SCI.AI. All rights reserved.

Powered by SCI.AI Intelligence Platform

Welcome Back!

Sign In with Facebook
Sign In with Google
Sign In with Linked In
OR

Login to your account below

Forgotten Password? Sign Up

Create New Account!

Sign Up with Facebook
Sign Up with Google
Sign Up with Linked In
OR

Fill the forms below to register

All fields are required. Log In

Retrieve your password

Please enter your username or email address to reset your password.

Log In

Scan to share via WeChat

Open WeChat and scan the QR code to share

QR Code

Add New Playlist

No Result
View All Result
  • Supply Chain
    • Strategy & Planning
    • Logistics & Transport
    • Manufacturing
    • Inventory & Fulfillment
  • Procurement
    • Strategic Sourcing
    • Supplier Management
    • Supply Chain Finance
  • Technology
    • AI & Automation
    • Robotics
    • Digital Platforms
  • Risk & Resilience
  • Sustainability
  • Research
  • Expert Columns
  • English
    • Chinese
    • English
  • Login
  • Sign Up

© 2026 SCI.AI