
February 2026 Market Snapshot: Demand Resilience Amid Geopolitical Shock
The Xeneta February 2026 air cargo market report presents a paradoxical foundation for the year’s logistics outlook: robust demand growth coexisting with acute systemic vulnerability. Global air cargo demand rose 6% year-on-year — the third consecutive month of positive YoY expansion — signaling underlying resilience across key manufacturing and consumer electronics sectors. This growth occurred despite persistent macroeconomic headwinds, including elevated interest rates, uneven global GDP forecasts, and ongoing trade policy uncertainty. Notably, the 6% increase was not evenly distributed: Northeast Asia recorded comparatively muted declines during Lunar New Year–affected periods, while South and Southeast Asia experienced steeper contractions due to structural dependence on Middle Eastern carrier networks. The demand uptick was further supported by seasonal factors, including pre-Lunar New Year inventory replenishment cycles and semiconductor procurement patterns tied to North American data center buildouts. However, this apparent strength masks a critical structural imbalance — capacity growth lagged at only +4% year-on-year, creating upward pressure on utilisation metrics before any external disruption occurred. This narrow supply-demand margin meant the market entered February 2026 with minimal buffer against exogenous shocks, rendering it exceptionally sensitive to sudden infrastructure loss.
What distinguishes February 2026 from prior recovery cycles is the timing and nature of the disruption. Unlike pandemic-era port congestion or Red Sea rerouting — which unfolded over weeks — the Middle East airspace crisis emerged with near-instantaneous effect following military strikes on 28 February and Iran’s retaliatory actions. Within 48 hours, commercial flight operations at Doha, Dubai, and Abu Dhabi were suspended, removing approximately 12% of global air cargo capacity from active service. This was not a gradual tapering of services but a systemic deactivation of critical node infrastructure. For shippers relying on the ‘hub-and-spoke’ model — particularly those moving high-value, time-sensitive goods such as pharmaceuticals, aerospace components, and memory chips — the loss of these hubs created immediate routing voids. Forwarders reported cascading delays on Asia–Europe lanes, where transshipment via Gulf hubs previously accounted for over 35% of total tonnage. The fact that demand remained +6% YoY *despite* this abrupt capacity shock underscores both the inelasticity of certain cargo segments and the extent to which the market had already been operating near full utilisation prior to the conflict.
From a cost-structure perspective, the February data reveals an inflection point in pricing dynamics. The dynamic load factor — Xeneta’s proprietary metric tracking real-time capacity utilisation based on flown volume and weight relative to available capacity — rose by two percentage points to 62%. This represents the highest level since November 2025 and signals tightening operational margins for airlines. A 62% load factor in air cargo is notably higher than historical averages (typically 55–59% in stable markets), indicating carriers are flying fuller freighters but also facing diminishing returns on marginal capacity additions. Crucially, this load factor increase occurred *before* the full impact of the airspace closures materialised — meaning the actual utilisation on remaining viable routes likely exceeded 70% in the first week of March. For shippers, this translates into reduced negotiation leverage, diminished booking certainty, and heightened exposure to last-minute surcharges. The market was no longer merely ‘tight’; it had become structurally constrained, with demand outpacing capacity growth by two percentage points even in nominal conditions — a gap that widened dramatically once geopolitical events removed a full twelfth of the world’s operational freighter capacity overnight.
Spot Rate Surge: $2.58/kg and the End of the Pricing Downturn
February 2026 marked a definitive turning point in air cargo pricing: spot rates rose 5% to USD $2.58 per kilogram, constituting the first monthly increase since May 2025. This reversal ended an eight-month period of flat or declining rates — a trend driven by excess capacity, aggressive forwarder discounting, and weak containerised freight correlation. The $2.58/kg figure is not merely a statistical blip; it reflects a fundamental recalibration of market equilibrium. Prior to February, spot rates had hovered around $2.45/kg, a level sustained by airline overcapacity and forwarder price wars aimed at preserving market share amid tariff-related demand softness from China to the U.S. The 5% jump therefore represents more than seasonal adjustment — it is evidence of a hardening floor beneath airfreight pricing, catalysed by the confluence of three forces: the Lunar New Year peak, US dollar depreciation (which improved exporters’ pricing power), and critically, the emergent capacity shock. Unlike previous rate increases tied solely to demand spikes, this one was underpinned by verifiable, irreversible infrastructure loss — making it far less reversible through conventional supply response.
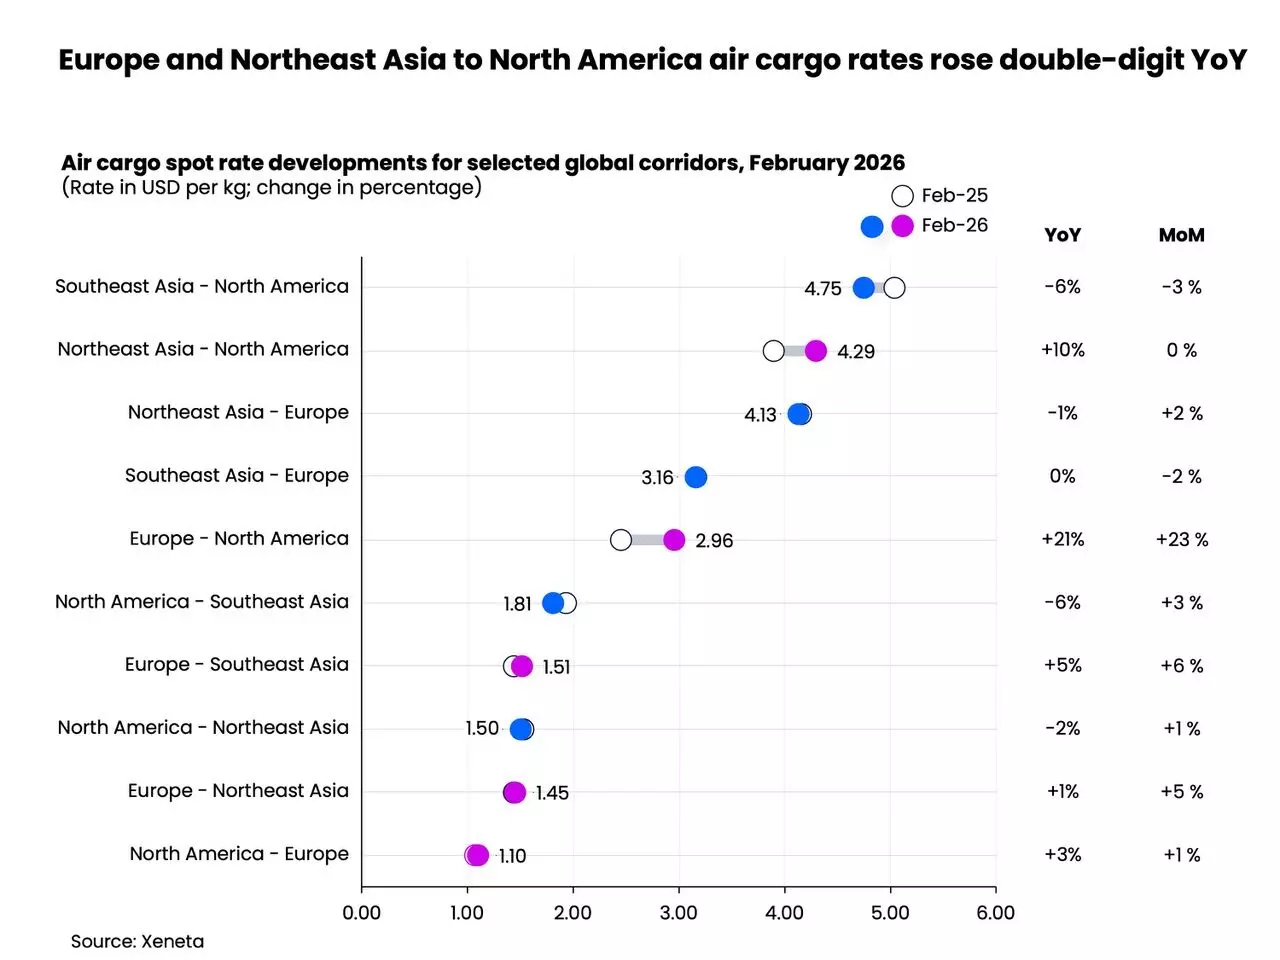
The corridor-level disparities in this rate surge reveal critical network vulnerabilities. The Europe–North America corridor saw the most dramatic YoY increase at +21% in spot rates, significantly outpacing the global average. This reflects both strong transatlantic demand for automotive parts and medical devices and the disproportionate reliance of European carriers on Gulf-based technical stops and crew rotations — routes now severely curtailed. Simultaneously, the Northeast Asia–North America corridor posted a +10% YoY increase, driven primarily by semiconductor shipments supporting AI chip fabrication in Arizona and Texas. Here, the constraint is less about airspace and more about aircraft availability: many freighters formerly deployed on Asia–Middle East–North America triangular routings were grounded or diverted, reducing direct lift options. In contrast, China–U.S. and China–Europe corridors showed muted growth or outright contraction due to tariff impacts, underscoring how geopolitical risk now operates on multiple, overlapping layers — trade policy *and* physical infrastructure — simultaneously. The result is a bifurcated market: high-growth, high-value corridors experiencing severe capacity compression, while legacy trade lanes face structural demand erosion.
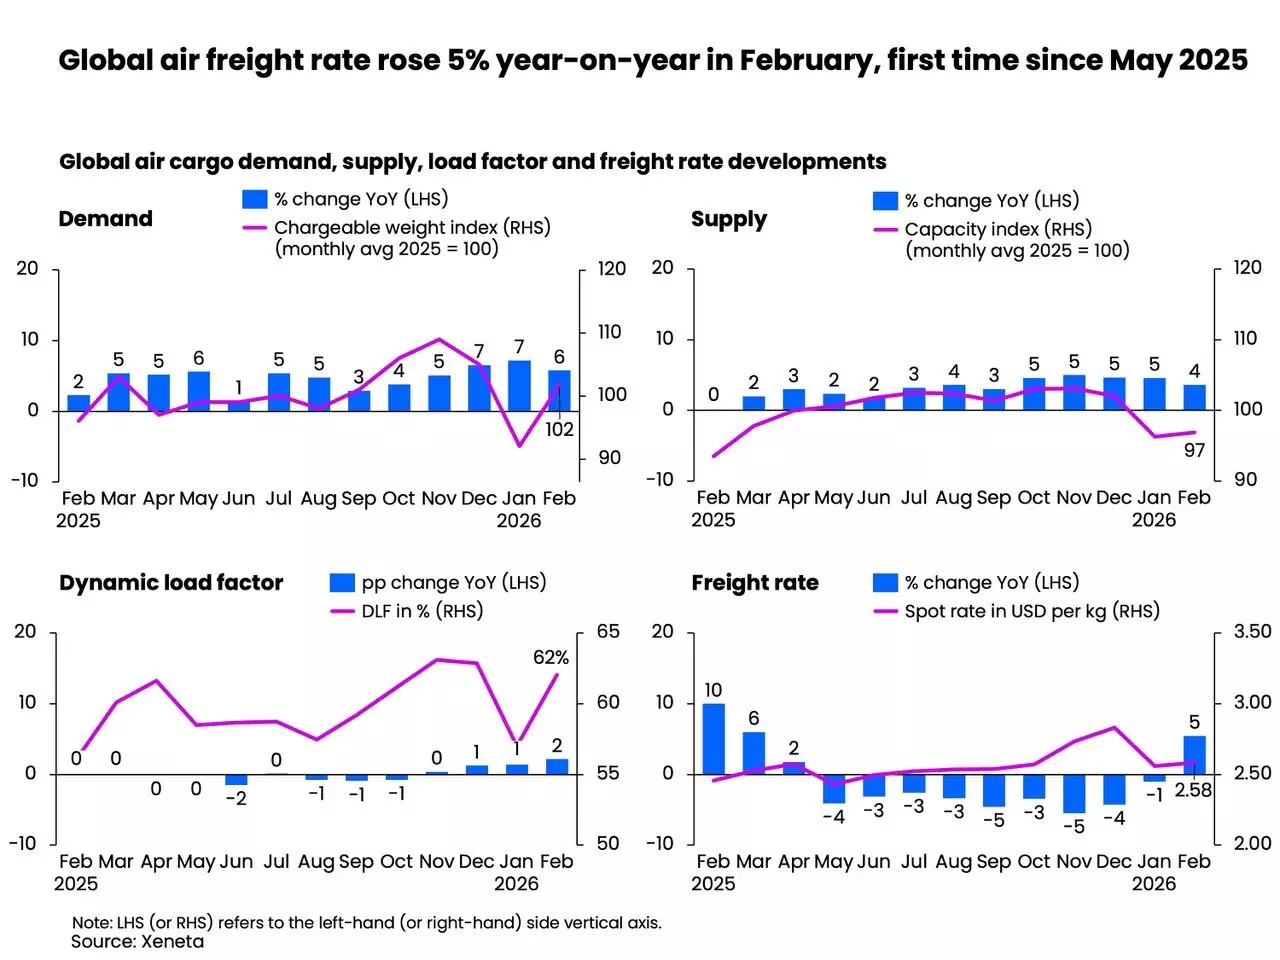
For logistics managers, the $2.58/kg benchmark carries profound implications for landed cost modelling. At this rate, shipping a single pallet (25 kg) from Shanghai to Frankfurt incurs ~$64.50 in base airfreight alone — up from $61.25 in January and $60.25 in December. While seemingly marginal, these increments compound across multimodal legs, customs brokerage, insurance, and warehousing. More critically, the 5% increase is not uniform: forwarders report spot rate volatility exceeding ±15% on short notice for ad-hoc bookings on affected corridors. This erodes budget predictability — a core pillar of supply chain finance. Airlines, meanwhile, face a strategic dilemma: raising rates sustains profitability but risks accelerating shipper migration to ocean-plus-air hybrid solutions or regional nearshoring. Yet holding rates flat is unsustainable when dynamic load factors exceed 62% and fuel costs rise alongside Hormuz-related oil price volatility. As Niall van de Wouw, Chief Airfreight Officer at Xeneta, observed:
“Then, on 28 February, we witnessed the strikes on Iran and the start of everything that has happened since. This is the world we are living in, and the reality for businesses facing one new challenge after another.”
Network Collapse: How 12% Capacity Loss Paralysed Hub-and-Spoke Architecture
The removal of ~12% of global air cargo capacity was not a proportional reduction across geographies — it was a targeted surgical strike on the central nervous system of modern air logistics. Doha, Dubai, and Abu Dhabi are not merely airports; they function as integrated logistics ecosystems with deep connectivity to feeder networks across Africa, South Asia, and Central Asia. Collectively, these hubs handle over 40% of all intercontinental air cargo transshipments, providing critical consolidation, deconsolidation, customs clearance, and value-added services (VAS) such as kitting, labelling, and temperature-controlled staging. Their suspension did not merely eliminate flight paths — it severed end-to-end process continuity. For example, a pharmaceutical shipment from Bangalore to Amsterdam previously moved via Dubai for temperature validation, documentation harmonisation, and regulatory pre-clearance. With Dubai offline, shippers faced either multi-day delays waiting for alternative VAS providers in Istanbul or Warsaw, or costly re-routes requiring full re-documentation and secondary inspections. This illustrates how capacity loss transcends aircraft availability: it degrades the *functional density* of the network — the number of value-creating touchpoints per kilometre flown.
This functional degradation disproportionately impacted South and Southeast Asian exporters, whose cargo volumes rely heavily on Middle Eastern carriers for access to European and North American markets. Data shows these regions registered the steepest demand declines in the first 48 hours post-conflict — not because orders vanished, but because the physical and procedural pathways to fulfil them disappeared. In contrast, Northeast Asia’s smaller decline reflects both stronger direct carrier presence (e.g., Korean Air, ANA, Cathay Pacific) and greater flexibility in deploying dedicated freighters on point-to-point routes. However, even this advantage is bounded: many Northeast Asian freighters historically used Gulf hubs for crew rest, maintenance, and fuel efficiency optimisation. Rerouting them via Central Asia introduces new constraints — limited night-flight permissions, insufficient ground handling infrastructure for wide-body freighters, and complex bilateral traffic rights negotiations. Kazakhstan’s Nursultan Nazarbayev International Airport, for instance, lacks certified cold-chain facilities for pharmaceuticals and has only two dedicated freighter stands. Thus, the 12% capacity loss triggers a cascade: reduced hub throughput → degraded service quality → increased transit times → higher inventory carrying costs → accelerated shift toward safety stock accumulation — all of which inflate total supply chain cost structures beyond headline airfreight rates.
Rerouting Realities: Central Asia’s Infrastructure Gap and Operational Constraints
With traditional Gulf corridors blocked, airlines and forwarders immediately explored Central Asian alternatives — primarily routes traversing Kazakhstan, Uzbekistan, and Kyrgyzstan. However, this ‘solution’ rapidly revealed deep-seated infrastructural and regulatory limitations. Central Asia’s airspace is among the most fragmented globally, governed by overlapping national regulations, outdated navigation systems, and limited radar coverage. While technically permissible for overflights, commercial freighter operations require landing rights, ground handling agreements, and customs interoperability — none of which exist at scale. For instance, Tashkent International Airport handles fewer than 50,000 tonnes of air cargo annually, compared to Dubai’s 2.3 million tonnes. Its single cargo terminal lacks automated sortation, bonded warehousing, or pharma-grade temperature zones. Attempts to use Almaty as a technical stop have stalled due to slot restrictions and fuel supply volatility — Kazakhstan imports 70% of its jet fuel, and domestic refining capacity cannot support sustained freighter turnaround volumes. Consequently, rerouting does not restore lost capacity; it redistributes bottlenecks, shifting delays from Dubai’s apron to Almaty’s customs hall or Nur-Sultan’s maintenance hangars.
Operational constraints compound these physical limitations. Most Central Asian civil aviation authorities lack established protocols for rapid freighter certification, leading to 48–72 hour delays for aircraft entry permits. Ground handling is often outsourced to state-owned entities with limited scalability, resulting in turn-around times exceeding six hours — double the industry standard. Furthermore, bilateral air service agreements (ASAs) between major cargo nations (e.g., U.S.–Kazakhstan or EU–Uzbekistan) remain rudimentary, granting only limited fifth-freedom rights and prohibiting cabotage. This means a Korean Air freighter flying Seoul–Almaty–Frankfurt cannot load cargo in Almaty for onward movement to Berlin — eliminating the very consolidation benefit that made Gulf hubs indispensable. The net effect is that rerouted freight moves slower, costs more (due to extended dwell times and premium handling fees), and offers lower service reliability. For time-definite shipments — such as automotive just-in-time parts or clinical trial materials — these compromises are operationally unacceptable, forcing shippers to absorb cost increases rather than risk production line stoppages or regulatory non-compliance.
The long-term implication is clear: supply chain diversification away from Gulf hubs cannot be achieved through ad-hoc rerouting. It requires multi-year investment in Central Asian airport infrastructure, harmonisation of customs procedures under frameworks like the Eurasian Economic Union, and renegotiation of ASAs to permit meaningful freighter connectivity. Until then, the ‘Central Asia alternative’ remains a tactical stopgap — useful for low-priority, non-perishable cargo but inadequate for high-value, time-critical shipments. This reality forces shippers into difficult trade-offs: pay premium rates on scarce direct services, accept extended lead times with higher inventory costs, or accelerate regional nearshoring initiatives — all of which fundamentally reshape sourcing strategies and capital allocation priorities.
Hormuz Strait Risk: Oil Price Volatility and Its Cascading Freight Impact
Beyond airspace, the Strait of Hormuz represents a second, equally potent layer of systemic risk — one rooted in energy security rather than aviation logistics. The strait handles around 20% of global oil shipments and about 30% of seaborne oil trade, making it the world’s most critical maritime chokepoint. Recent attacks on vessels in Persian Gulf waters have intensified security concerns, triggering immediate insurance premium hikes and vessel speed reductions — both of which elevate ocean freight costs and extend transit times. While air cargo and ocean freight operate in distinct modal domains, their cost structures are inextricably linked through fuel. Jet fuel (Jet-A1) is refined from crude oil, and its price tracks Brent crude with a typical 30–45 day lag. A sustained 10% increase in Brent prices — plausible given Hormuz instability — would raise Jet-A1 costs by 7–8%, directly impacting airline operating expenses. Since fuel accounts for 25–30% of total freighter operating costs, this translates into a 2–2.5 percentage point margin compression — a pressure point that will inevitably feed into spot rate negotiations. Airlines cannot absorb such cost increases indefinitely without passing them on, especially when dynamic load factors sit at 62% and capacity remains constrained.
This energy–logistics nexus creates a self-reinforcing cycle of cost escalation. Higher oil prices → higher jet fuel costs → higher airfreight rates → increased incentive for shippers to shift volume to ocean → higher demand for container ships → higher bunker fuel demand → further upward pressure on crude prices. The February 2026 data already hints at this feedback loop: while air cargo demand grew +6% YoY, ocean freight indices (per Drewry and Xeneta’s concurrent analysis) showed a +12% spike in Asia–Europe container rates — suggesting early modal substitution is underway. However, this substitution is incomplete: ocean cannot replicate air’s speed for high-value electronics or life sciences shipments. Thus, the market bifurcates further — with airfreight becoming a premium, high-cost solution for mission-critical cargo, and ocean absorbing bulk, lower-value, and less time-sensitive flows. For multinational enterprises, this necessitates dual-track logistics planning: one strategy for ‘air-only’ critical paths (requiring guaranteed capacity and premium pricing), and another for ‘ocean-primary’ lanes (requiring enhanced inventory buffers and demand forecasting precision). The Strait of Hormuz is no longer just an energy concern — it is a primary driver of air cargo cost inflation and modal strategy recalibration.
Moreover, the Hormuz risk compounds existing Middle East capacity constraints. Many freighter operators previously relied on ‘dual-use’ flights — passenger aircraft belly capacity on routes that also carried significant oil and gas industry personnel and equipment. With regional passenger demand collapsing due to security fears, these belly capacities vanished, removing an estimated 8–10% of auxiliary air cargo lift. This hidden capacity loss is rarely captured in headline ‘freighter-only’ statistics but materially tightens the overall market. Combined with the 12% freighter capacity removal, the total effective capacity contraction approaches 20% on key Asia–Europe lanes — a threshold that transforms pricing from cyclical to structural. Shippers must therefore treat Hormuz-related volatility not as a transient event but as a permanent feature of 2026 cost modelling — embedding oil price sensitivity into every airfreight contract, hedging fuel exposure where possible, and stress-testing supply chain resilience against sustained $90+/barrel crude scenarios.
Strategic Implications: From Tactical Response to Structural Adaptation
The February 2026 air cargo market data signals a decisive end to the era of abundant, predictable, low-cost airfreight. What was once viewed as a flexible, on-demand capacity buffer is now exposed as a fragile, geopolitically contingent infrastructure. For shippers, the imperative shifts from rate negotiation to network architecture. Relying on single-carrier contracts or hub-dependent routing is no longer tenable; resilience now demands multi-carrier, multi-corridor, and multi-modal orchestration. This requires investment in digital twin capabilities to simulate disruption scenarios, real-time visibility platforms to track cargo across fragmented routing paths, and contractual frameworks that incentivise collaboration over competition — such as shared capacity pools or joint venture freighter operations. Forwarders, too, must evolve beyond transactional brokering: the value proposition now lies in end-to-end orchestration — securing slots, managing customs complexity across five jurisdictions, and guaranteeing temperature integrity across three handovers. Those who fail to integrate these capabilities will cede market share to integrated logistics providers with embedded air cargo expertise and owned assets.
Airlines face parallel strategic imperatives. The 62% dynamic load factor and $2.58/kg spot rate confirm that pricing power has returned — but sustainability requires more than rate hikes. Carriers must accelerate fleet modernisation (replacing older, fuel-inefficient freighters with Boeing 777F and 787-9BCF variants), deepen partnerships with e-commerce platforms for guaranteed volume commitments, and invest in digital booking ecosystems that reduce sales friction. Critically, they must engage proactively with governments on airspace liberalisation — advocating for open skies agreements in Central Asia and streamlined overflight permissions. The days of passive capacity provision are over; airlines must become active architects of resilient infrastructure. Meanwhile, policymakers confront urgent questions about strategic air cargo capacity. National freighter fleets — long neglected in favour of passenger aviation — are now recognised as critical infrastructure, akin to port terminals or fibre-optic networks. Countries including Germany, Japan, and South Korea are reportedly reviewing subsidies for dedicated freighter acquisitions, while the EU is fast-tracking regulatory harmonisation for cross-border air cargo VAS. These developments suggest that airfreight is transitioning from a commercial service to a component of national economic security — a paradigm shift with profound implications for investment, regulation, and public-private collaboration.
Ultimately, the Xeneta February 2026 report is not merely a market update — it is a diagnostic of systemic fragility. The 6% demand growth, 4% capacity growth, 62% dynamic load factor, $2.58/kg spot rate, +21% Europe–North America corridor increase, and 12% global capacity removal are not isolated metrics; they form an interconnected narrative about the limits of globalisation’s current architecture. Supply chains built for efficiency are now being stress-tested for endurance. The question is no longer whether disruption will occur, but how quickly and effectively organisations can transform reactive contingency plans into proactive, adaptive systems. As Niall van de Wouw noted, the industry’s historical adaptability remains intact — but adaptation now comes at a quantifiably higher cost, demanding deeper integration, smarter technology, and bolder strategic choices. The air cargo market of February 2026 is not broken — it is being fundamentally rebuilt.
Related Reading:
- 5 Disruptive Logistics Shifts Reshaping 2026 Supply Chains
- Hormuz Strait Alert Meets Red Sea Reopening: How the Middle East’s Twin Chokepoint Crisis Is Reshaping Global Shipping in 2026
Source: stattimes.com
This article was AI-assisted and reviewed by our editorial team.