According to theloadstar.com, global container shipping schedule reliability declined to 37% in June 2026 — a two-percentage-point drop from May’s 39%, the highest level since December 2023 — as port congestion reversed earlier gains.
Q2 recovery stalls amid rising delays
Xeneta’s Global Reliability Scorecard shows that on-time carrier performance averaged 39% in May 2026, following consecutive monthly improvements from 36% in March to 37% in April. Average delays fell to 3.4 days — the lowest since July 2025. However, June marked a reversal: on-time arrivals slipped to 37%, and average delays edged up to 3.6 days.
Destine Ozuygur, senior market analyst at Xeneta, noted the fragile nature of the rebound:
“Global on-time performance hit 39% in May… This was the closest reading to the 40% ceiling we’ve seen since December 2023.” — Destine Ozuygur, senior market analyst at Xeneta
She added that June “checked our collective optimism; no trade improved, on-time arrivals fell, 2pp to 37%, and delay crept back up to 3.6 days.”
Alliance and carrier-level performance diverges
Among carrier alliances, the Gemini Cooperation maintained top-tier reliability in Q2 2026, averaging 69% on-time performance with just 1.1 days of average delay. The Ocean Alliance posted the largest improvement, lifting schedule reliability by 15 percentage points to 43%. On individual carrier performance, Maersk led with 58% Q2 reliability, followed by Hapag-Lloyd at 57%. CMA CGM ranked third at 46%, while Wan Hai was the only major carrier to deteriorate — falling 6 percentage points to 15%.
Keith Gaskin, MD and founder of ShiftX, emphasized the operational tension behind these figures:
“Capacity is only usable if it can be deployed, removed at the port, and loaded at the port efficiently and on time, and it’s been a huge issue this year.” — Keith Gaskin, MD and founder of ShiftX
He explained that carriers sometimes “cut and run” — skipping port calls — when congestion prevents timely container turnaround, inadvertently rolling cargo for shippers who met all deadlines.
Trade lane disparities widen
Performance varied sharply across routes. East Coast South America saw the strongest quarterly gain, jumping 17 percentage points to 54%. West Coast South America reached 48%. Far East–Europe rose 14 percentage points to 39%, while both Far East–North America and Europe–North America improved by 7 percentage points each. In stark contrast, the Middle East trade deteriorated: on-time arrivals fell in May even as all other lanes improved, closing Q2 at just 25%.
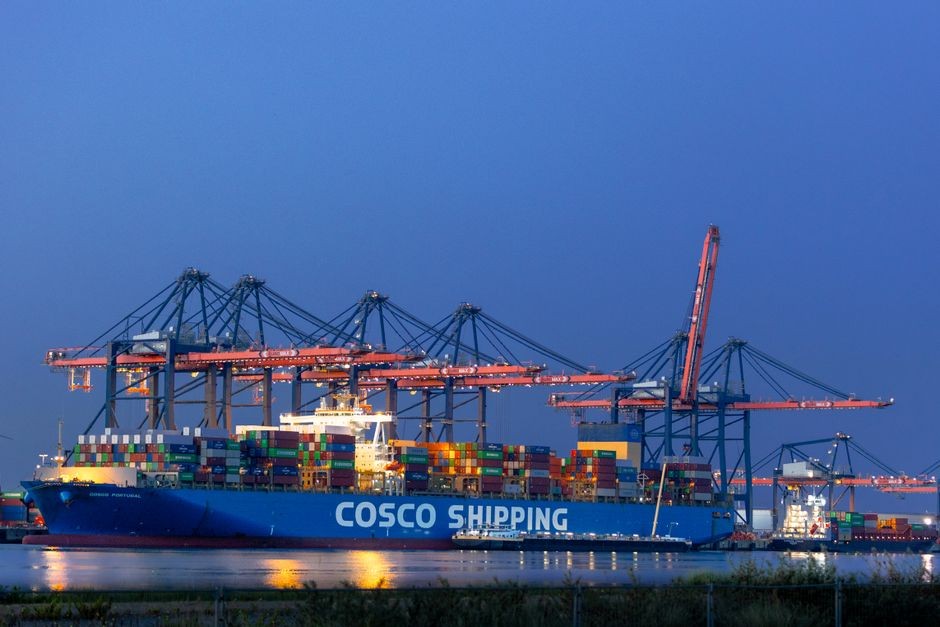
Gaskin identified Northern European ports — especially Rotterdam — as persistent bottlenecks causing network-wide knock-on disruption. “I think people now just build-in a big buffer for some of these delays,” he said.
Capacity management eases slightly
Despite the June dip, capacity pressures eased overall in Q2. Blanked sailings dropped to 9% of planned TEU in June — equivalent to approximately 890,000 TEU — marking the first month in 2026 with fewer blank sailings than the same month in 2025. This reflects reduced need for schedule adjustments compared to last year, though port congestion continues to constrain throughput efficiency.
Ozuygur underscored that “the global recovery is real,” citing sustained Q2 gains and structural improvements in blank sailing frequency. Still, she warned that congestion remains the dominant constraint — not vessel availability or demand volatility — making port infrastructure and labor productivity the decisive factors for near-term reliability.
Source: The Loadstar
Compiled from international media by the SCI.AI editorial team.