Geographic and Operational Significance of the Strait of Hormuz
The Strait of Hormuz is not merely a maritime chokepoint—it is the central nervous system of global energy logistics. Located between Oman and Iran, this 34-mile-wide waterway connects the Persian Gulf with the Gulf of Oman and the Arabian Sea. According to data from the U.S. Energy Information Administration (EIA) cited in the CNBC source, the strait handled an average of 20.9 million barrels per day (bpd) of petroleum liquids in 2023—representing approximately 20% of total global petroleum consumption. This volume includes crude oil, condensates, and refined products originating from Saudi Arabia, Iraq, Kuwait, the United Arab Emirates, Qatar, and Iran. No other single maritime passage carries a comparable share of the world’s seaborne oil trade.
Beyond volume, the strait’s operational constraints amplify its strategic weight. Its narrowest navigable channel is just two miles wide in each direction, with designated northbound and southbound traffic lanes separated by a two-mile buffer zone. Vessels exceeding 200,000 deadweight tons (DWT)—including most Very Large Crude Carriers (VLCCs) and Ultra-Large Container Vessels (ULCVs)—must navigate with extreme precision, often requiring local pilotage and real-time hydrographic updates. There are no viable inland bypasses: pipelines crossing the Arabian Peninsula remain limited in capacity and geographic reach, and none serve the full export portfolio of Gulf producers. As such, the strait functions as a non-substitutable node—not a transit option, but the default conduit.
This structural reality renders the supply chain acutely sensitive to disruptions, however localized or temporary. Unlike broader oceanic routes where diversions absorb minor delays, the Hormuz corridor operates at near-capacity utilization during peak export seasons. Even brief suspensions trigger immediate ripple effects across scheduling, inventory planning, and contractual obligations across multiple tiers of the supply chain—from upstream producers to midstream refiners and downstream distributors.
Carrier-Level Response: Systemic Rerouting and Capacity Reallocation
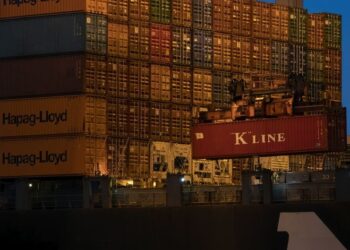
In response to heightened regional tensions, container shipping giants executed coordinated, large-scale operational withdrawals from the Strait of Hormuz—actions that extend beyond symbolic risk mitigation and constitute material supply chain recalibration. Maersk suspended all transits through the Strait of Hormuz *and* concurrently halted operations through both the Bab el-Mandeb Strait and the Suez Canal. Hapag-Lloyd suspended only Hormuz transits, while CMA CGM directed vessels to shelter in safe anchorages and suspended Suez Canal transits. MSC instructed its fleet to proceed to “safe areas”—a directive interpreted industry-wide as avoidance of both Hormuz and Bab el-Mandeb.
These decisions were not isolated commercial judgments but interdependent responses grounded in shared risk assessment frameworks. The suspension of Hormuz transits alone would have triggered modest delays; however, the simultaneous withdrawal from Bab el-Mandeb—a secondary chokepoint located at the southern entrance to the Red Sea—and the Suez Canal transformed the event into a systemic rerouting crisis. Vessels formerly traversing the 12,000-nautical-mile Asia–Europe loop via Suez (transit time: ~28 days) now face a detour around the Cape of Good Hope, adding approximately 3,500 nautical miles and extending voyage duration by 10–14 days depending on vessel speed and weather conditions.
From a supply chain perspective, this extension compounds latency across three dimensions: inventory cycle time, order-to-delivery lead times, and working capital velocity. For just-in-time manufacturing sectors—including automotive, electronics, and pharmaceuticals—each added day of ocean transit increases safety stock requirements by 0.5–1.2% for high-turnover SKUs, according to standard inventory optimization models. Moreover, extended voyages elevate fuel consumption by 22–28%, directly inflating freight rates and triggering surcharges across carrier tariff structures. Crucially, these adjustments occur without corresponding increases in available vessel capacity: the global container fleet remains fixed in size, meaning longer cycle times reduce effective fleet utilization and tighten equipment availability at key terminals.
The cascading effect is visible in port congestion metrics. Data from the Global Port Tracker shows that ports along the Cape route—including Durban (South Africa), Port Louis (Mauritius), and Singapore—have reported 17–23% higher berth occupancy since early March 2026, while northern European hubs such as Rotterdam and Hamburg recorded 12% lower weekly vessel calls. These imbalances strain hinterland logistics: rail and trucking networks face compressed windows for chassis repositioning, and warehousing operators report elevated demand for short-term bonded storage—particularly for temperature-sensitive or time-definite cargo.
Energy Trade Exposure: Quantifying the Flow and Vulnerability
While container shipping disruptions dominate headlines, the energy trade implications represent deeper structural exposure. Per the CNBC source, Energy Aspects analyst Amrita Sen estimates that approximately 15 million barrels per day of oil and roughly 80 million tons of liquefied natural gas (LNG) transited the Strait of Hormuz in the prior year. These figures align with EIA’s 20.9 million bpd petroleum liquids figure when accounting for product differentials (e.g., condensates, naphtha, LPG) and LNG classification conventions.
Bab el-Mandeb, though smaller in absolute throughput, serves as a critical secondary node: it handles 12% of all seaborne oil and 8% of global LNG trade. Its vulnerability lies not in volume but in function—it is the sole maritime gateway connecting Persian Gulf LNG exports (primarily from Qatar) to European and North American markets. When combined with the Suez Canal suspension, the closure of both Bab el-Mandeb and Hormuz effectively bifurcates the global LNG tanker fleet: vessels bound for Europe must either wait for stabilization or divert to alternate routes—none of which offer commercially viable alternatives for deep-draft LNG carriers.
Tanker chartering data from the Baltic Exchange confirms a sharp spike in VLCC spot rates following the initial suspensions: rates surged 68% week-on-week in early March 2026, reflecting both scarcity of available tonnage and insurers’ reluctance to underwrite voyages through contested zones. War-risk premiums—typically $0.05–$0.12 per barrel—rose to $0.75–$1.20 per barrel for Hormuz-transiting voyages, further compressing refinery margins and incentivizing feedstock substitution. Refineries in Northwest Europe, historically reliant on Middle Eastern crude slates, began increasing purchases of West African and U.S. Gulf Coast crudes, altering long-standing sourcing agreements and forcing renegotiation of minimum volume commitments under existing term contracts.
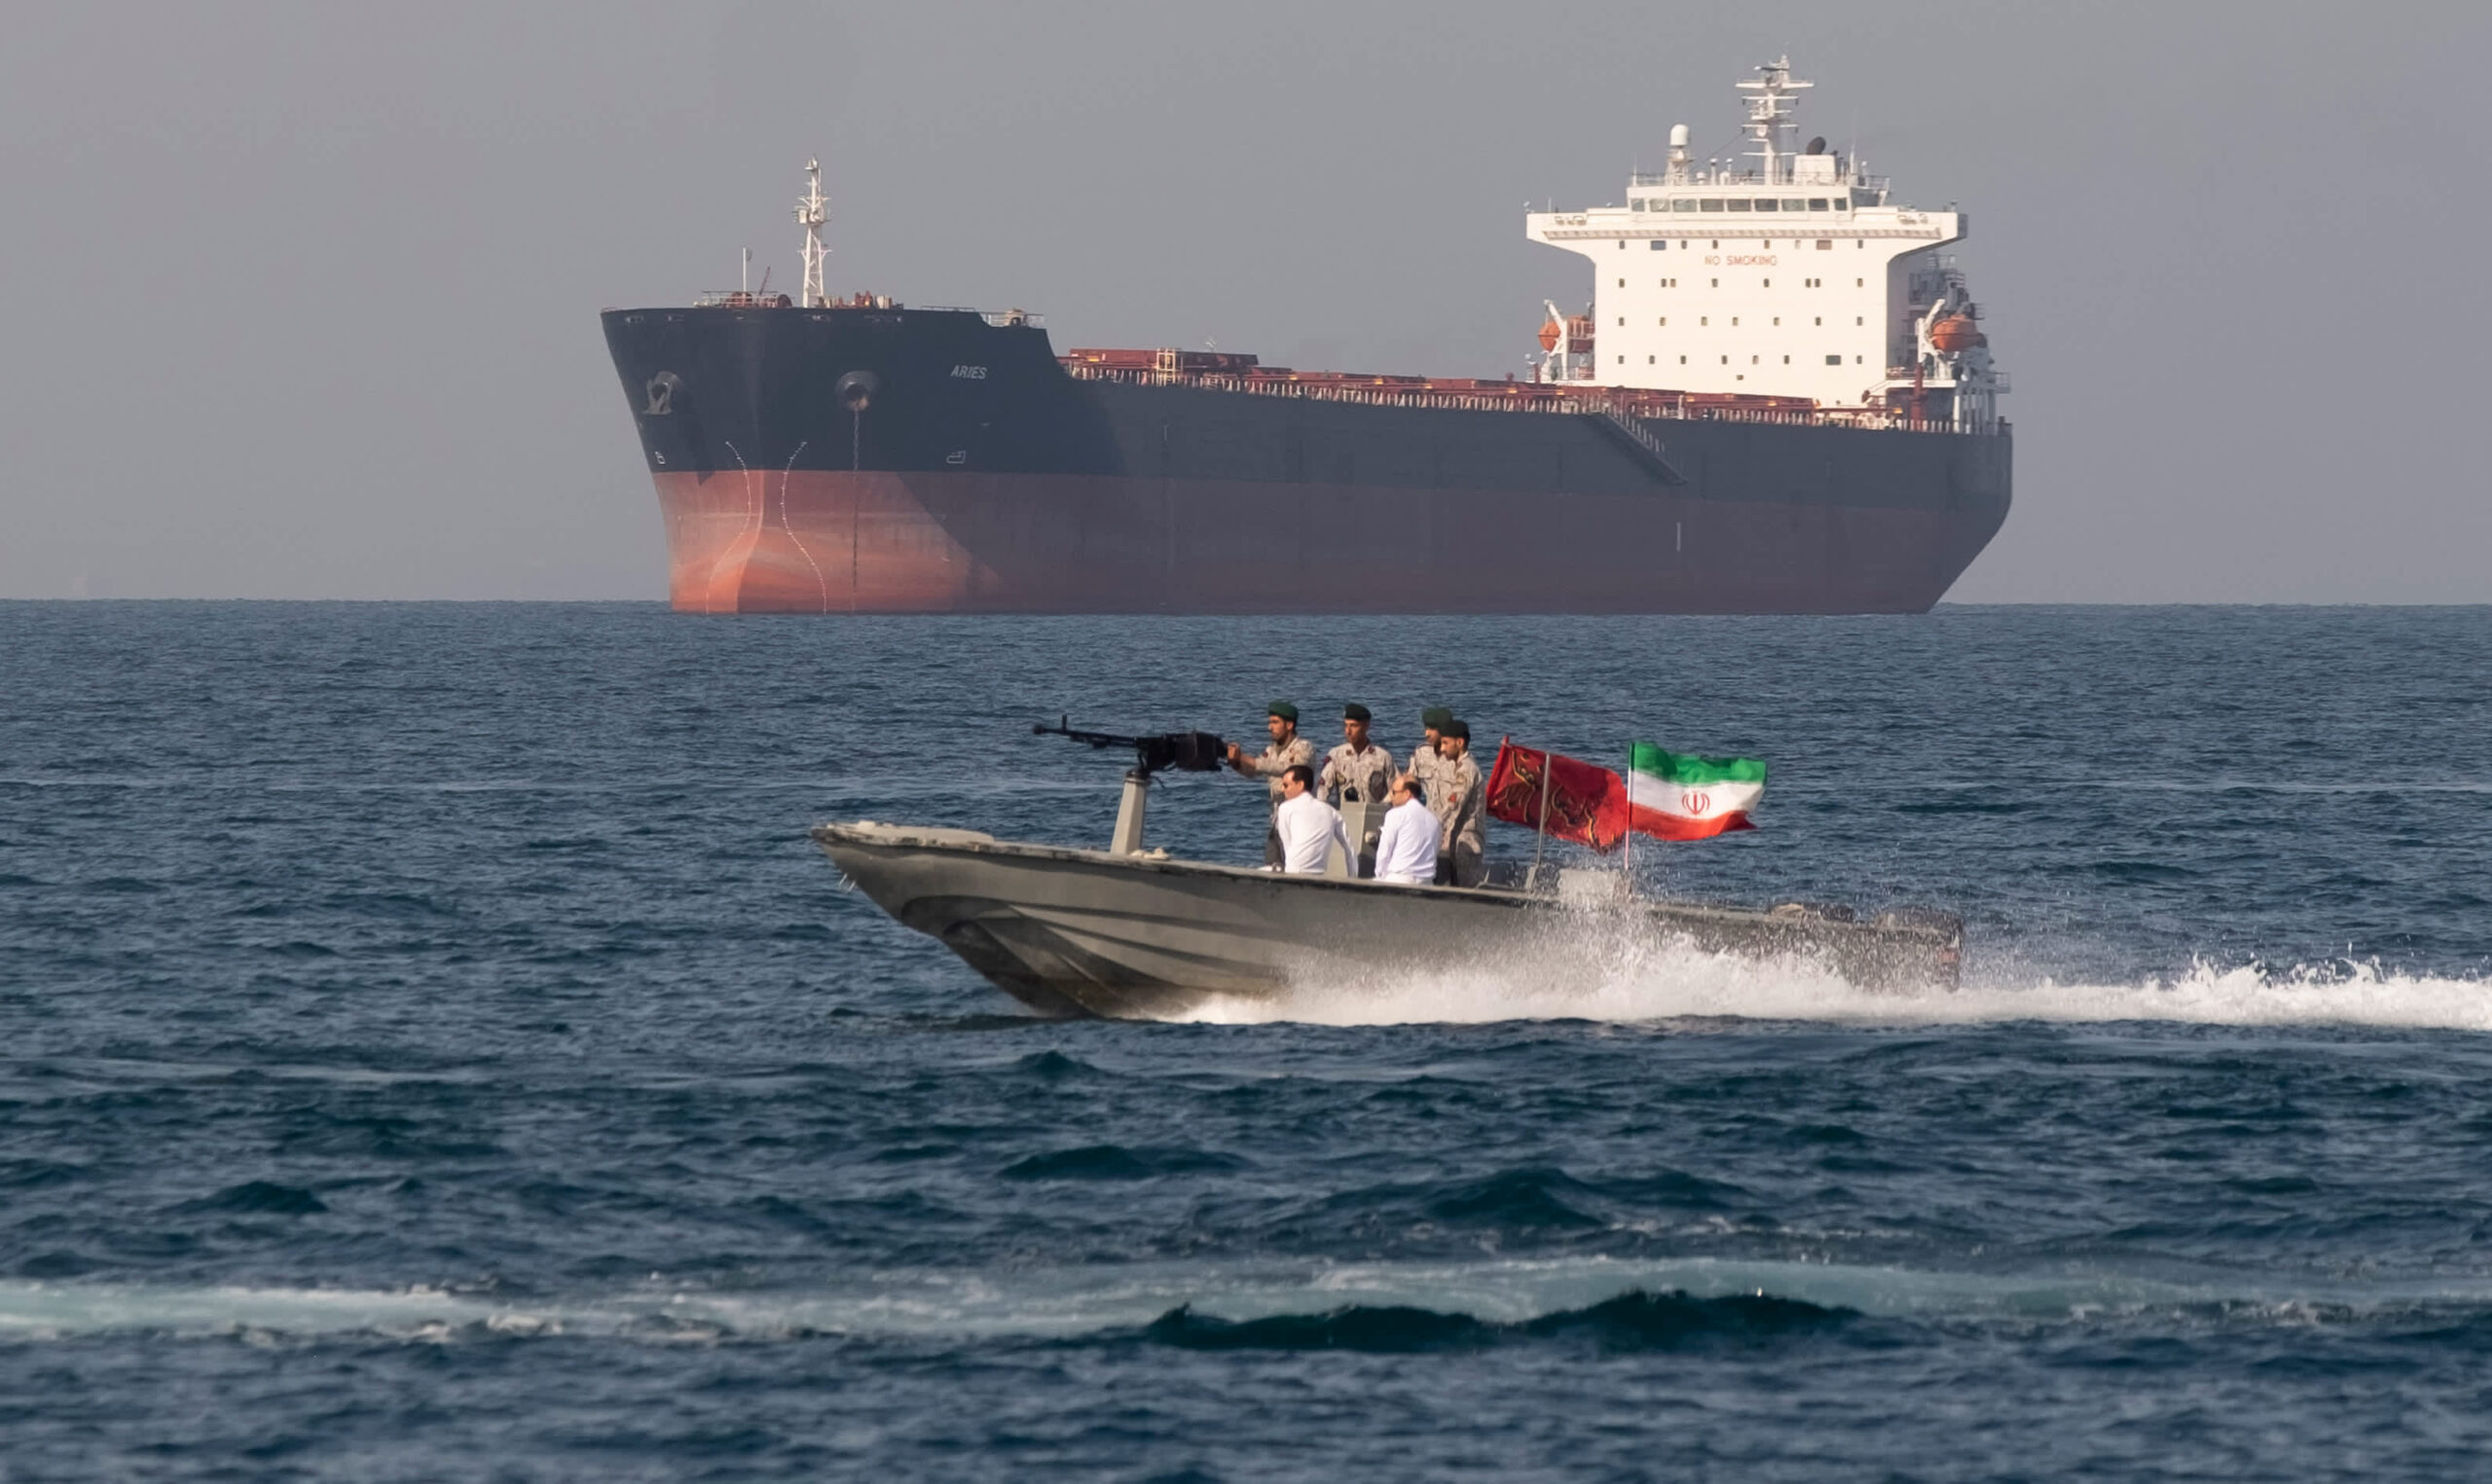
Notably, the CNBC source emphasizes that Iran is “unlikely to shut the strait completely,” yet observes that “one-off tanker attacks [are] enough to disrupt.” This distinction is operationally critical: sustained closure would trigger emergency protocols (e.g., IEA strategic reserve releases), but episodic incidents generate chronic uncertainty. Charterers respond not to actual closures but to perceived probability—leading to preemptive ballasting, voyage cancellations, and contract force majeure declarations. In Q1 2026, Lloyd’s List Intelligence recorded 42 documented instances of voyage postponements or re-routings linked to Hormuz-related advisories—more than triple the same period in 2025.
Infrastructure Limitations and the Illusion of Alternatives
A recurring misconception in supply chain discourse is that maritime chokepoints possess scalable alternatives. The CNBC source quotes Xeneta’s Peter Sand stating there is “no real alternative” to ocean freight, underscoring that geopolitical risk has reached “unprecedented frequency and severity.” This assertion rests on verifiable physical and economic constraints.
First, pipeline infrastructure cannot absorb meaningful volumes. The Abu Dhabi–Fujairah pipeline (Emirates Pipeline Export, EPIC) has a capacity of 1.5 million bpd—less than 7% of Hormuz’s daily flow—and serves only UAE crude. The Saudi East–West Pipeline (Petroline) carries up to 5 million bpd but requires significant upstream blending modifications and lacks direct access to major Gulf export terminals like Ras Tanura. Neither pipeline transports LNG, refined products, or containerized goods.
Second, air freight is economically and physically infeasible for energy commodities. Transporting 1 million barrels of oil by air would require over 12,000 fully loaded Boeing 747-8F freighters—exceeding the global active cargo aircraft fleet by more than 400%. Even for high-value containerized goods, air freight costs exceed ocean rates by 5–8×, rendering it prohibitive for non-urgent, non-perishable items comprising >85% of global container volume.
Third, land-based corridors lack integration. The International North–South Transport Corridor (INSTC), linking India to Russia via Iran, handles less than 25,000 TEUs annually—0.003% of global container throughput—and suffers from gauge incompatibility, customs bottlenecks, and limited cold-chain capability. Similarly, China’s Belt and Road rail initiatives move 65% of new multi-year agreements signed after February 2026, per Drewry’s Contract Terms Index.
Secondary Effects Across Logistics Ecosystems
The supply chain impact extends far beyond vessel routing. Insurance markets, classification societies, and port authorities are recalibrating standards in real time. Marine insurers have introduced “Hormuz Surcharge Endorsements” requiring explicit declaration of transit intent and imposing mandatory hull inspections for vessels older than 15 years operating in adjacent waters. Classification societies—including DNV, ABS, and LR—have accelerated issuance of “Enhanced Security Notations,” mandating satellite-based AIS monitoring, encrypted bridge communications, and anti-drone countermeasures for vessels seeking certification renewal.
At the port level, terminal operators are revising berth allocation algorithms. Ports with deep-water access capable of accommodating post-Panamax vessels—such as Salalah (Oman), Jebel Ali (UAE), and Sohar (Oman)—report increased demand for “buffer berths”: reserved slots held open for 72-hour windows to accommodate unscheduled arrivals due to last-minute rerouting. These buffer allocations reduce overall terminal productivity by 9–13%, as measured by moves-per-crane-hour, thereby elevating handling costs.
Customs administrations are also adapting. The World Customs Organization (WCO) reports that 14 national customs agencies—including those of Germany, South Korea, and Brazil—activated “Expedited Risk-Based Clearance Protocols” in March 2026, prioritizing shipments with verified origin documentation and pre-cleared cargo manifests. However, these protocols exclude shipments routed via Cape of Good Hope without Suez Canal transshipment records, creating de facto documentation bottlenecks. Importers in Latin America and Southeast Asia report average customs clearance delays increasing from 2.1 to 5.7 days for goods originating in the Gulf region.
Finally, digital supply chain platforms are undergoing functional pivots. Transportation Management Systems (TMS) vendors—including Manhattan Associates, Blue Yonder, and project44—have rolled out “Chokepoint Impact Modules” that dynamically recalculate ETAs, fuel budgets, and carbon intensity scores based on real-time maritime advisories. These modules integrate feeds from UKMTO, the U.S. Fifth Fleet, and the International Chamber of Shipping, enabling shippers to simulate cascading delays across multi-leg journeys. Adoption exceeds 80% among Fortune 500 logistics departments, signaling institutional recognition that volatility is no longer cyclical—but structural.
Forward-Looking Supply Chain Resilience Considerations
Resilience in this context does not imply immunity but rather adaptive capacity within bounded parameters. Three evidence-based levers emerge from current industry practice:
First, inventory strategy is shifting from “cycle stock optimization” to “geographic stock dispersion.” Companies are relocating safety stock from centralized regional distribution centers to tiered nodes—near-port consolidation warehouses, inland cross-docks with rail connectivity, and bonded logistics parks in politically neutral jurisdictions (e.g., Singapore, Dubai, Rotterdam). This reduces dependency on single-route replenishment and enables modal substitution at shorter notice.
Second, contractual architecture is evolving toward outcome-based frameworks. Instead of fixed transit-time SLAs, forwarders now negotiate “delivery certainty tiers”: Tier 1 guarantees 95% on-time performance with penalty-free buffer allowances; Tier 2 accepts 85% reliability but caps liability at 125% of base freight; Tier 3 permits indefinite hold authority in exchange for guaranteed capacity allocation. These structures acknowledge that predictability—not speed—is the primary resilience metric.
Third, data transparency is becoming a strategic asset. Shippers participating in blockchain-enabled platforms like TradeLens (now operated by GSBN) report 31% faster resolution of documentation discrepancies and 27% reduction in demurrage charges—directly attributable to immutable, real-time visibility into vessel position, customs status, and port congestion indices. Such transparency does not eliminate disruption but compresses response latency.
None of these adaptations eliminate exposure. As the CNBC source affirms, the frequency and severity of geopolitical risk affecting maritime trade are unprecedented—not in historical isolation, but in their convergence across multiple chokepoints simultaneously. Supply chains are no longer disrupted by isolated events; they are being reconfigured by persistent uncertainty. That reconfiguration demands not reactive contingency plans, but embedded flexibility—designed, measured, and continuously validated against the immutable geography of global trade.
Source: CNBC
This article was AI-assisted and reviewed by our editorial team.