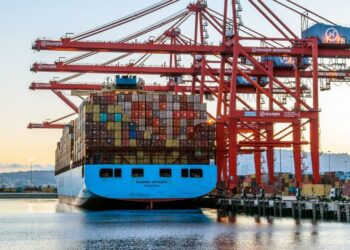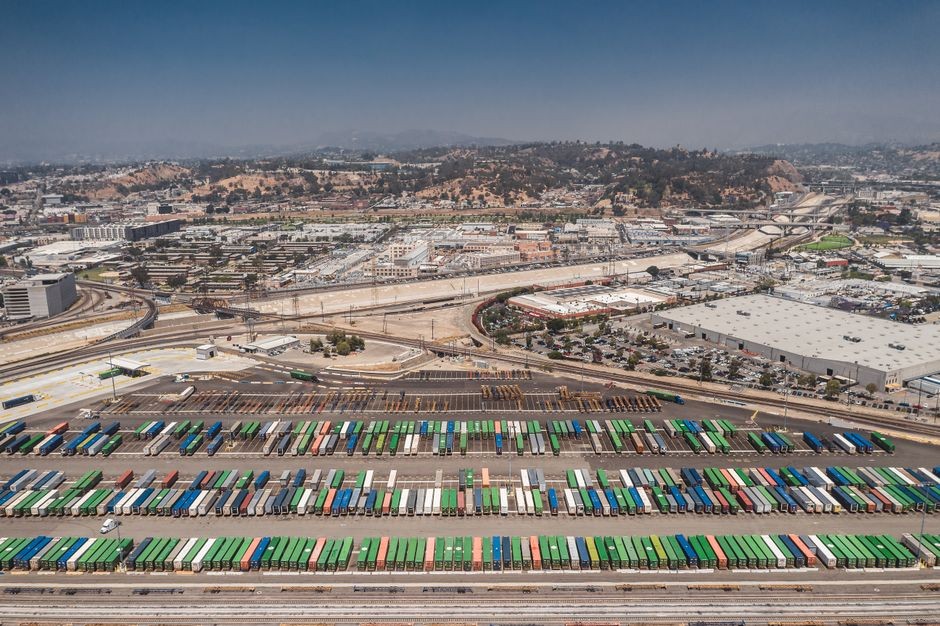
According to www.thescxchange.com, U.S. containerized imports declined by 1.2% month-over-month in June 2026, totaling 2,400,627 twenty-foot equivalent units (TEUs).
June Import Volume and Year-to-Date Trends
The slight dip reflects typical seasonal easing rather than structural decline, per Descartes Systems Group’s July Global Shipping Report. China-origin imports fell just 0.2% from May — a marginal adjustment amid persistent trade tensions. For the first half of 2026, total U.S. container import volumes were down 0.3% year-on-year compared to the same period in 2025, but surged 22.2% above pre-pandemic levels in 2019.
Drivers of Supply Chain Volatility Through 2026
Descartes Systems Group identifies four concurrent pressure points shaping supply chain decisions through the second half of 2026: Middle East maritime risk, elevated tariff uncertainty, new Panama Canal draft restrictions, and ongoing Red Sea disruption. These geopolitical and infrastructural challenges are now the dominant factors influencing sourcing, routing, and inventory planning — surpassing traditional cost or lead-time considerations.
Strategic Priorities for U.S. Importers
Jackson Wood, Director of Industry Strategy at Descartes, emphasized that volatility demands proactive adaptation: “Over the first six months of the year, aggregated U.S. containerized imports showed little variance compared to the same period last year. However, as we head into the second half of 2026, global trade continues to face high levels of volatility… For U.S. importers, sourcing diversification, landed cost visibility and risk mitigation remain key strategies to manage in this environment.”
Operational Implications for Supply Chain Professionals
Practitioners report increasing reliance on real-time port congestion data, multi-carrier contingency routing, and near-term demand sensing tools — not for optimization alone, but for resilience triage. The 22.2% growth versus 2019 underscores that underlying import demand remains robust, even as trade flows shift geographically and logistically. Meanwhile, the 1.2% monthly contraction in June confirms that seasonal patterns still hold — albeit within a narrower band of predictability than in prior decades.
Source: thescxchange.com
Compiled from international media by the SCI.AI editorial team.