According to www.presgo.com, carbon emissions are classified into three categories—Scope 1, Scope 2, and Scope 3—under the GHG Protocol, the globally recognised framework for corporate greenhouse gas accounting. These scopes define responsibility based on operational control and value chain boundaries, not physical location. While reporting of Scope 1 and Scope 2 emissions is mandatory under most regulatory regimes—including the EU’s CSRD and Singapore Exchange (SGX) listing rules—Scope 3 reporting remains voluntary in most jurisdictions, though rapidly gaining traction.
Scope 1: Direct Emissions Under Operational Control
Scope 1 emissions—also called direct emissions—arise from sources owned or controlled by the company. As defined by the GHG Protocol, these include all seven greenhouse gases listed under the Kyoto Protocol: carbon dioxide (CO₂), methane (CH₄), nitrous oxide (N₂O), hydrofluorocarbons (HFCs), perfluorocarbons (PFCs), sulphur hexafluoride (SF₆), and nitrogen trifluoride (NF₃). Gases outside this list—such as chlorofluorocarbons (CFCs) or nitrogen oxides (NOx)—must be excluded from Scope 1 and reported separately.
Key categories include:
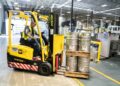
- Mobile combustion: Emissions from company-owned or leased vehicles—e.g., delivery vans, maintenance trucks, and warehouse forklifts—using diesel, gasoline, or propane.
- Stationary combustion: Fuel burned in fixed equipment like boilers, furnaces, and emergency generators at facilities across manufacturing plants, offices, and data centers.
- Fugitive emissions: Unintentional releases—for example, SF₆ leaks from electrical switchgear or refrigerant losses from HVAC systems. One kilogram of SF₆ has a global warming potential 23,500 times greater than CO₂ over 100 years (IPCC AR6).
- Process emissions: CO₂ released during chemical transformations—not fuel combustion—such as cement clinker production, where ~60% of emissions stem from limestone calcination.
- Agricultural emissions: Methane from enteric fermentation in livestock and nitrous oxide from synthetic fertilizer application on company-managed farmland.
Calculation follows four steps: (1) identify all emission sources; (2) collect activity data—e.g., litres of diesel consumed, kilogrammes of refrigerant lost, or tonnes of steel produced; (3) apply IPCC- or national-agency-provided emission factors; and (4) aggregate totals. For instance: 100,000 kWh × 0.5 kg CO₂e/kWh = 50,000 kg CO₂e (50 tonnes).
Scope 2: Indirect Emissions from Purchased Energy
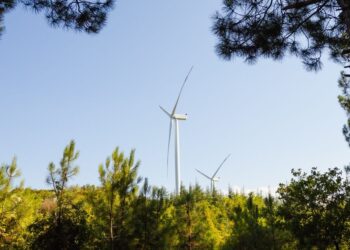
Scope 2 emissions result from the generation of purchased electricity, steam, heating, and cooling consumed by the organisation. Though physically emitted off-site—typically at power plants or district energy facilities—the company bears accountability because its demand drives those emissions. According to the report, reducing Scope 2 emissions hinges on two levers: improving energy efficiency and shifting procurement toward renewable sources such as wind, solar, or hydropower.
Examples include:
- Purchased electricity: Emissions tied to grid-supplied power for offices, warehouses, and production lines.
- Purchased steam: Used in food processing, pharmaceutical sterilisation, or textile dyeing.
- Purchased heating: District heating systems serving multi-tenant office buildings in cities like Copenhagen or Berlin.
- Purchased cooling: Centralised chilled water systems common in commercial high-rises across Singapore and Dubai.
Scope 2 calculation uses location-based (grid average) or market-based (renewable energy certificate–verified) emission factors. The latter enables companies to claim lower emissions when procuring certified green power.
Scope 3: Value Chain Emissions—Upstream and Downstream
Scope 3 emissions encompass all other indirect emissions occurring in a company’s value chain—both upstream (suppliers, raw materials, transportation) and downstream (product use, end-of-life, employee commuting). Per the source, Scope 3 typically accounts for over 70% of a company’s total carbon footprint, especially in sectors like consumer goods, automotive, and technology. Unlike Scopes 1 and 2, Scope 3 includes 15 distinct categories—from business travel and waste disposal to investments and leased assets.
The article outlines five actionable reduction strategies:
- Work with suppliers that publicly disclose emissions and hold third-party ESG certifications.
- Design products for durability, repairability, and recyclability—e.g., modular electronics or reusable packaging.
- Encourage low-carbon workplace practices: remote work policies reduced commuting emissions by up to 40% for firms with hybrid models (Global Workplace Analytics, 2023).
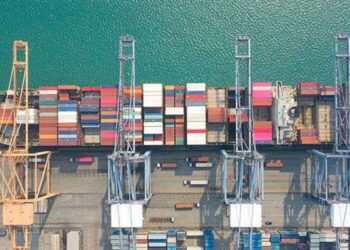
- Optimise transport and logistics: switching from air freight to sea freight cuts emissions per tonne-kilometre by ~90%.
- Offset residual emissions only after exhausting abatement options—using verified credits aligned with the Verra or Gold Standard frameworks.
Reporting Scope 3 emissions supports compliance with emerging mandates—including the EU’s CSDDD, which requires large companies to assess and mitigate adverse impacts across their value chains starting in 2026. It also strengthens investor confidence: 82% of S&P Global 1200 companies published Scope 3 data in 2024, up from 54% in 2020 (CDP Global Report).
Source: www.presgo.com
Compiled from international media by the SCI.AI editorial team.